


Talking Points:
- US Dollar Upside Momentum May Be Starting to Fade
- S&P 500 Consolidating After Tagging Six-Week Low
- Crude Oil Probes Below $54, Gold in Digestion Mode
Can’t access the Dow Jones FXCM US Dollar Index? Try the USD basket on Mirror Trader. **
US DOLLAR TECHNICAL ANALYSIS – Prices may be losing steam after hitting a new 11-year high as signs of negative RSI divergence begin to emerge. A daily close back below the 38.2% Fibonacci expansionat 12107 exposes the 23.6% level at 11965. Alternatively, a push above the 50% Fib at 12221 opens the door for a challenge of the 61.8% expansion at 12335.
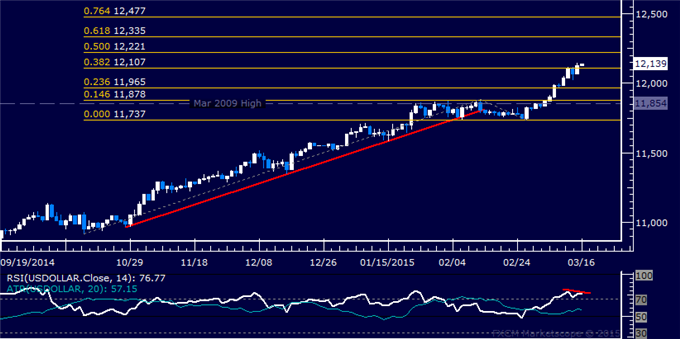
Daily Chart - Created Using FXCM Marketscope
** The Dow Jones FXCM US Dollar Index and the Mirror Trader USD basket are not the same product.
S&P 500 TECHNICAL ANALYSIS – Prices are digesting losses after sliding to the weakest level in a month. A daily close above the 23.6% Fibonacci expansion at 2073.10 exposes the 38.2% level at 2093.50. Alternatively, a reversal below the 2033.00-40.10 area marked by the March 11 low and the 61.8% Fib retracement targets the 76.4% threshold at 2012.60.
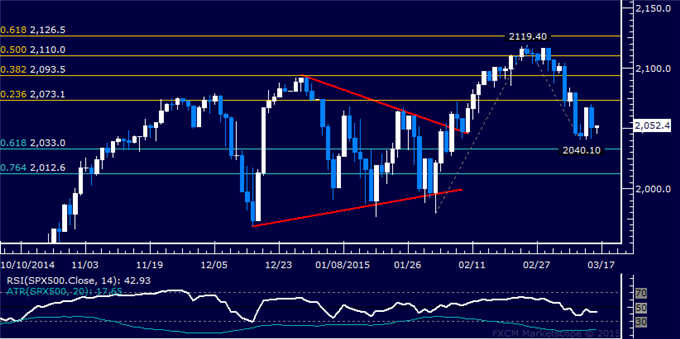
Daily Chart - Created Using FXCM Marketscope
GOLD TECHNICAL ANALYSIS – Prices are digesting losses after dropping to a three-month low. A break above the 50% Fibonacci expansion at 1163.43 on a daily closing basis exposes the 38.2% level at 1177.51. Alternatively, a push below the 61.8% Fib at 1149.35 targets the 76.4% expansion at 1131.92.
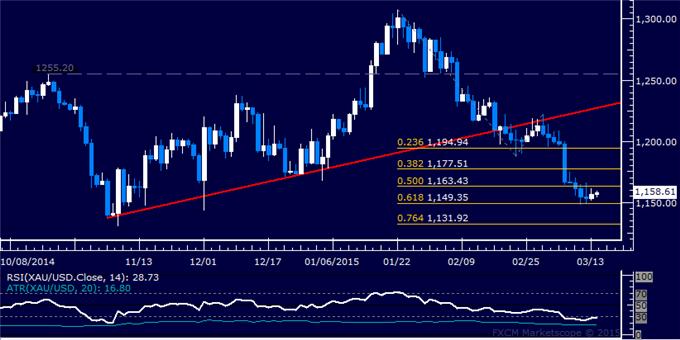
Daily Chart - Created Using FXCM Marketscope
CRUDE OIL TECHNICAL ANALYSIS – Prices resumed pushing lower, sliding to the lowest level in a month. A break below the 50% Fibonacci retracement at 54.08 exposes the 61.8% level at 51.97. Alternatively, a reversal above the 38.2% Fib at 56.18 targets the 58.17-78 area marked by the 23.6% retracement and the February 6 close.
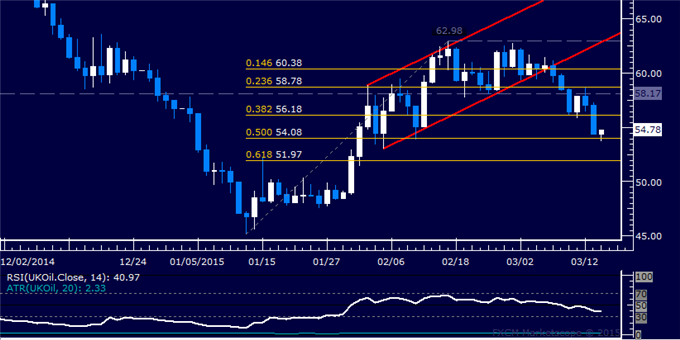
Daily Chart - Created Using FXCM Marketscope
--- Written by Ilya Spivak, Currency Strategist for DailyFX.com
To receive Ilya's analysis directly via email, please SIGN UP HERE
Contact and follow Ilya on Twitter: @IlyaSpivak


