


Talking Points:
- Fibonacci Retracement tracks the pullback after an extended move
- Traders eye 38.2%, 50%, and 61.8% retracements as possible reversal levels
- Fibonacci’s ‘magic’ comes from its self-fulfilling nature
Of all of the support and resistance tools taught by the DailyFX team and myself, the tool I receive the most questions about is the Fibonacci Retracement. Maybe it’s due to the intriguing name, or because it looks complicated at first glance, but “Fibs” are usually on technical traders’ short list of tools they would like to learn more about.
Today, we take a look at how to use the Fibonacci retracement tool on our charts and uncover the “magic” that can make it work.
Where to Draw the Fibonacci Retracement?
Unfortunately, Fibonacci will not automatically appear on your chart like a moving average or RSI will. We must draw on the chart ourselves where we would like the Fibonacci to go. But where exactly is that? For starters, we need to identify an extended move up or down on our chart. In other words, a swing low followed by a defined high or a swing high followed by a defined low. Below, we have an example of a swing high (labeled 1) followed by a swing low (labeled 2).
Learn Forex: Drawing Fibonacci Retracement on a Chart
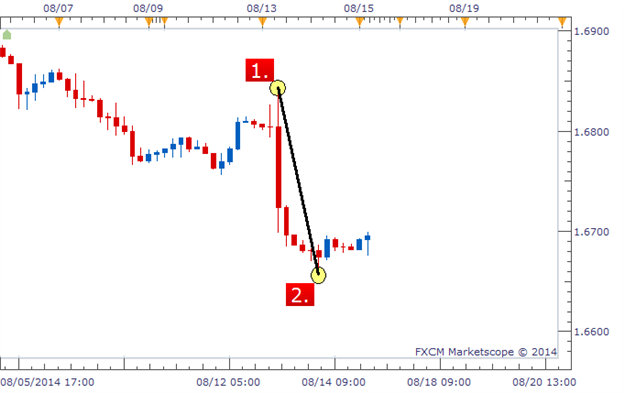
(Created using Marketscope 2.0 charting package)
The Fibonacci Retracement requires us to mark these two points, left-to-right. So after clicking the Fibonacci Retracement button at the top of our Marketscope charts, we would click point 1 and drag down to point 2 and release. The tool will do the rest of the work for us.
What Do the Fibonacci Lines Mean?
After drawing the two data points, we see 3 blue lines appear between the high and the low: 0.382, 0.500, and 0.618. These numbers represent how far price could retrace in percentage terms. So if price rose back to the 0.382 level, that would be a retracement of 38.2% of the original move. If price rose to the 0.500 level, that would be a retracement of 50% of the original move. If price rose to the 0.618 level, that would be a retracement of 61.8% of the original move.
We can see these levels labeled in the chart below as potential resistance levels. These are price levels that price could bounce off of.
Learn Forex: Fibonacci Retracement Projecting Potential Resistance Levels
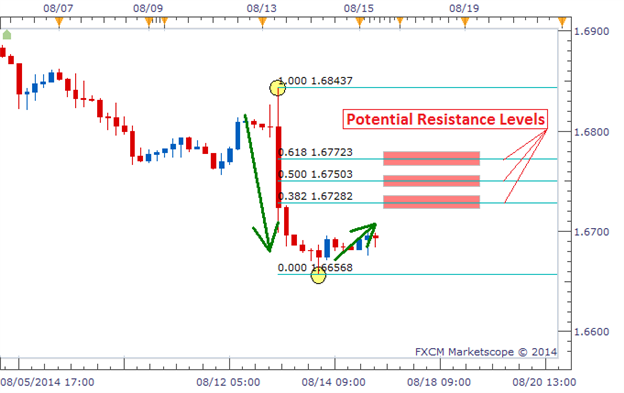
There is no exact science to determine which level price will bounce or if price will bounce off any of the levels at all. But time and time again, we will see price bounce off of one of these three retracement levels created by using Fibonacci.
Why Does Fibonacci Seem to Work?
This is probably the most popular question I get regarding Fibonacci. Why does price bounce off these levels? What is the ‘magic’ that causes this? In my opinion, there is no magic involved in it at all. What causes price to sometimes react around these levels is due to the fact that many people are watching these exact same levels.
If we have a large number of traders all looking at the same levels for a turnaround in price, they could create a cluster of orders that causes price to actually turn around at that level. It won’t always be that cut and dry, but that is the gist of using this type of tool. We are expecting other traders to be looking at these levels and cause price to react at these levels. It is self-fulfilling,
Learn Forex: Price Bouncing Off Fibonacci’s 38.2% Retracement Level
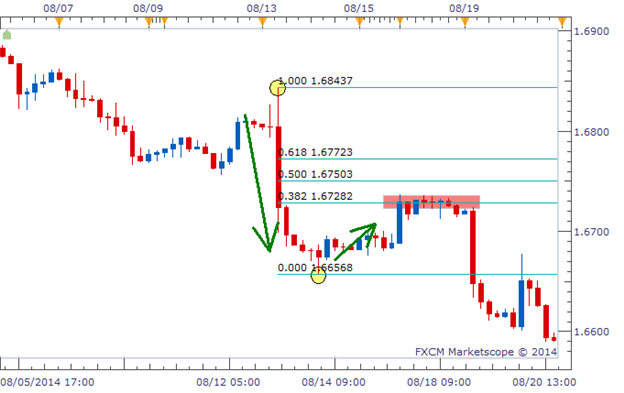
The chart above shows the outcome of our example. Price retraced up to the 38.2% retracement level and stalled for a while before moving back in the direction of the original move. Traders that traded the potential bounce off of this level had a very successful trade without having to take on a lot of risk if they used a tight stop.
Fibonacci Fraternity
So hopefully this article has unlocked the mystery behind Fibonacci by showing how to draw this tool on a chart and by teaching why the Fibonacci can, at times, create successful trades. You are now on your way to joining the Fibonacci club. If you would like to try the Fibonacci Retracement tool risk-free, download a Free Forex Demo account today with free charts and real-time pricing data. It takes seconds to create and minutes to setup.
Good trading!
---Written by Rob Pasche
Start your Forex trading on the right foot with the Forex Fast-Track Webinar Series. This 4-part, live webinar course is the disciplined Traders’ Fast-Track to the Forex Market. Topics include:
- Using FXCM’s award-winning trading platform
- Calculating Leverage and reducing risk
- Trading with a simple (yet effective) trading strategy
- Maintaining for Forex account and enrolling in on-going education
This course is completely free, so sign up or watch on-demand today.


