


Article Summary: This article will walk through some very simple tools available to traders that can assist in seeking out the attractive breakout market conditions. We explain that fundamentals and news announcement can often provoke breakouts, and then we go on to explain how traders can look to enter positions and manage risk when trading breakouts.
One of the most beautiful parts of the FX market can be found in the midst of the chaos that ensues during a fast market. Prices can tick in 4 or 5 pip increments as dealers across the world scramble to limit their exposure to the imposing flurry of orders emanating from profit hunters around the globe. These fast markets can be extremely friendly to traders if they are on the right side of the move. But if they are not, they can be more than equally as painful. This is called a breakout; and we walked through this market condition in our article, ‘The Ballistics of Breakouts.’
In its simplest form, a breakout is merely the transitory stage between a range and a trend. Sure, some breakouts can merely find themselves in another range once setting a new high or low; but quite often at least some permutation of a trend will result once previously defined support or resistance yield to surging prices. These fast-moving markets can usually be accompanied by fundamental news events; making the resulting conditions even more exciting.
A Range in EURJPY yields to surging prices
And it’s because of this very nature of breakouts that traders can strategize their hunt for these potentially profitable conditions. Traders can use very simple indicators to look for entries into breakout positions, and plan risk management to ensure that proper breakout protocols are in place. But before going into the strategy, a note of caution...
As mentioned previously, breakouts can be perhaps even more than equally as costly as they can be profitable; and this is because breakout entries left without proper risk management can wipe out a trader’s account in its entirety. If it’s a market moving quickly enough, it can reverse in the other direction even faster than it made its initial move. And if a stop is not on the trade, or if the leverage used is exorbitant - the results can be catastrophic. So, proper risk management should be used at all times - regardless of how strong the trade idea may be. At its least common denominator, any trade is just a single idea... don’t let a single idea cause ruin to your career or account.
Catching a Trend from a Range
Like a butterfly flowering from a cocoon, trends will often begin after prices breakout from a previously defined pattern of congestion or consolidation. Prices will often move for a reason of some sort. Of recent, Central Bank commentary has been a common cause of many breakouts. Traditionally, data releases are the biggest cause of support or resistance breaches, creating shockwaves through markets as traders attempt to price in new information.
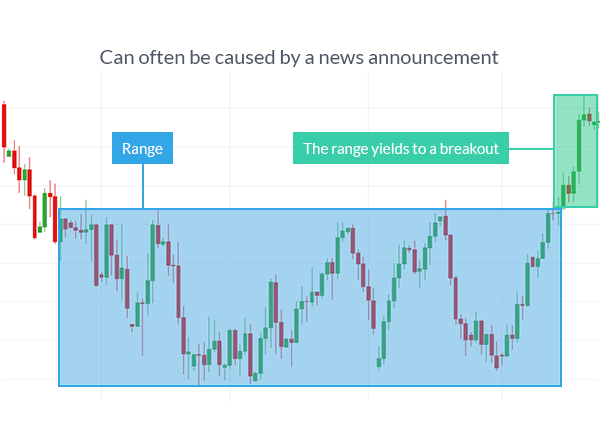
Breakouts can commonly occur during news releases, such as we had outlined in the article, Attacking News Events with Price Action. The picture below, taken from the article, illustrates a breakout taking place as a range was broken:
Breakouts can commonly occur around news announcements
Unfortunately, by the time the news or data enters the market, it’s often too late to catch the breakout. Instead, the risk of entering may be even bigger as the chance of a pullback potentially draining a trader’s account makes the prospect of chasing the move dicey... at best. It’s often best to sit back and wait for the trend to develop if the initial breakout is missed.
Instead, traders can integrate a very simple technical indicator to assist in looking for ranges that may, eventually, turn into a breakout.
The indicator is Average True Range, and it’s one of the fleet of indicators developed by J. Welles Wilder. We investigated this indicator in the article, Managing Risk with ATR; but this time, we’re going to use Average True Range to look for ranging periods in the market.
A quick fun fact about ATR: Like the other indicator developed by J. Welles Wilder, the default input is often used as 14 periods. I once heard a story, of which I cannot confirm its’ truth - that 14 periods was selected because J. Welles was a student of astrology, and 14 periods was one-half of the lunar cycle.
And while I cannot confirm the story, it does lead me to keep an open mind about the input periods for the indicator. J. Welles Wilder was undoubtedly a genius as a mathematician and engineer; but I do not share his passion for financial astrology.
Average True Range will measure the movement in the market, and as price movements increase in value, ATR will as well. The picture below will illustrate further, using 20 periods as an input:
As price movements get smaller, so does the reading on ATR

And it’s during these phases of market activity that traders can begin hunting for breakouts; after noticing that the market is showing some degree of a range as prices stay bound between support and resistance.
Finding an Entry Point
There are numerous ways this can be done, simplest of which is to notice the high or the low that was made before prices began congesting. The picture below will illustrate:
Traders can use entry orders to ‘buy new highs’ or ‘sell new lows’
And if traders want an indicator to help point these prices out, Price Channels, aka ‘Donchian Channels,’ will do just that - displaying the ‘highest high’ and the ‘lowest low,’ for the last x periods (with x being the number of periods you input). For this strategy, robust data is not necessary, so a small input such as 10 can be used for the Price Channel indicator.
Price Channels can be a helpful indicator to the Breakout Trader

Once this location is found, traders can place an entry orders just outside of this price, and by ‘just outside,’ we mean that if you are placing a long order to buy you would want to look slightly higher than the previous high. Or if an order to sell, the trader would want to enter slightly lower than the previous low. This is in an effort to prevent the dreaded ‘false breakout.’ An entry order can be placed so that once this level is hit, the trade is automatically entered. So, if this is a fast moving market caused by a news event - this order will enter the trader’s position without them needing to manually pull the trigger right when the chaos is entering the market. Without entry orders, trading breakouts would be exponentially more difficult. Without entry orders, trading breakouts would be very similar to chasing moves, which as we mentioned earlier can be disastrous should a reversal occur.
Risk Management
The allure of breakouts is not in their predictability, as breakouts are anything but predictable. The benefit of breakouts is the fast movement: So that IF the trader is on the right side of the move, and IF the move continues in the trader’s direction - they MAY be able to potentially profit from said movement.
That’s a lot of ‘ifs.’
Quite simply, a fast market can reverse very quickly; or a quick rush of volatility can just barely inch across support or resistance to trigger a breakout entry before putting the trader in a very precarious position.
This is where money management comes into play.
You can’t tell the future. Neither can I; or any other human being for that matter. And this is precisely why risk management is so utterly important in all facets of trading. Because breakouts are fast-moving, and volatile - this degree of variability can be seen as being even higher than in a normal range-bound or trending market.
The Number One Reasons Traders Fail is inadequate risk-reward. At all times, at the very least, traders should be looking for as much on the reward side as they offer to give up on the risk side of the trade. With breakouts, traders should look for an even bigger reward relative to the amount of risk being taken on. After all, if the breakout turns out to be a big movement, the larger reward should be more feasible. And if the trade turns out to be a dud, the loss will be minimal.
A one-to-four risk-to-reward ratio - or risking $10 dollars to make $40 - a trader would need to win only once out of 5 trades - to break-even, not including commissions. That’s 20%! Which means: if the trader is winning 21% of their breakouts with a 1-to-4 risk-reward ratio, they can possibly see a net profit: Winning only 21%!!!!
Setting the stop
Since ATR has already been used to look for the range that may turn into a breakout, we can, once again, look to the indicator to place the stop. This can be taken directly from the indicator, as we had explained in Managing Risk with ATR.
Traders are generally best advised to set the stop on the trade based on the time frame that they are using for their analysis and placing their trades. We explained this premise, along with suggesting suitable time frames based on the trader’s goals in the article, The Time Frames of Trading.
Trade management
Breakout trades can also be accentuated by a break-even stop. This would mean moving the stop on the trade to the initial entry price once a pre-determined amount of profit is seen in the trade.
This would allow the trader to remove their initial risk from the trade, while allowing the movement time to develop. This also affords the trader the opportunity to reemploy that risk elsewhere, on another trade idea, or perhaps even another potential breakout entry.
Next: Can False Breakouts be Prevented? (34 of 50)
Previous: Trading Tokyo Ranges with Price Action
--- Written by James Stanley
To contact James Stanley, please email JStanley@DailyFX.com. You can follow James on Twitter @JStanleyFX.
To join James Stanley’s distribution list, please click here.


