


Market Recap
Following last Friday’s reversal, major US indices managed to hold onto their gains this time round (DJIA +1.16%; S&P 500 +0.90%; Nasdaq +0.61%). But given that earnings season should see some winding down ahead, further catalysts have to be sought ahead to continue the rally. US Treasury saw larger moves at the long end, with the 10-year yields up 5 basis-point (bp). The 2-year yields were mainly flat, alongside the US dollar, reflecting some wait-and-see ahead of the US inflation data this week.
Overnight economic data saw a positive surprise in US consumer credit (US$17.85 billion vs US$13 billion), which could suggest that consumer spending may remain supported, at least for now. That may continue to keep sentiments basking in soft landing hopes until conditions are able to show a sharper deterioration to the downside. Thus far, the US economic surprise index continued to hover around its highest level since March 2021
For the S&P 500, buyers have managed to defend its 4,500 level overnight but more follow-through may need to be seen as its relative strength index (RSI) continues to hover around the key 50 level on the daily chart. Since March this year, dips in the daily RSI below the 50 level have been short-lived, with one to watch if buyers can jump in to defend the line this time round as well. Breaking back below the 4,500 level for the index may potentially leave the 4,300 level on watch next, where a support confluence arises from its Ichimoku cloud support on the daily chart, along with its 100-day moving average (MA).
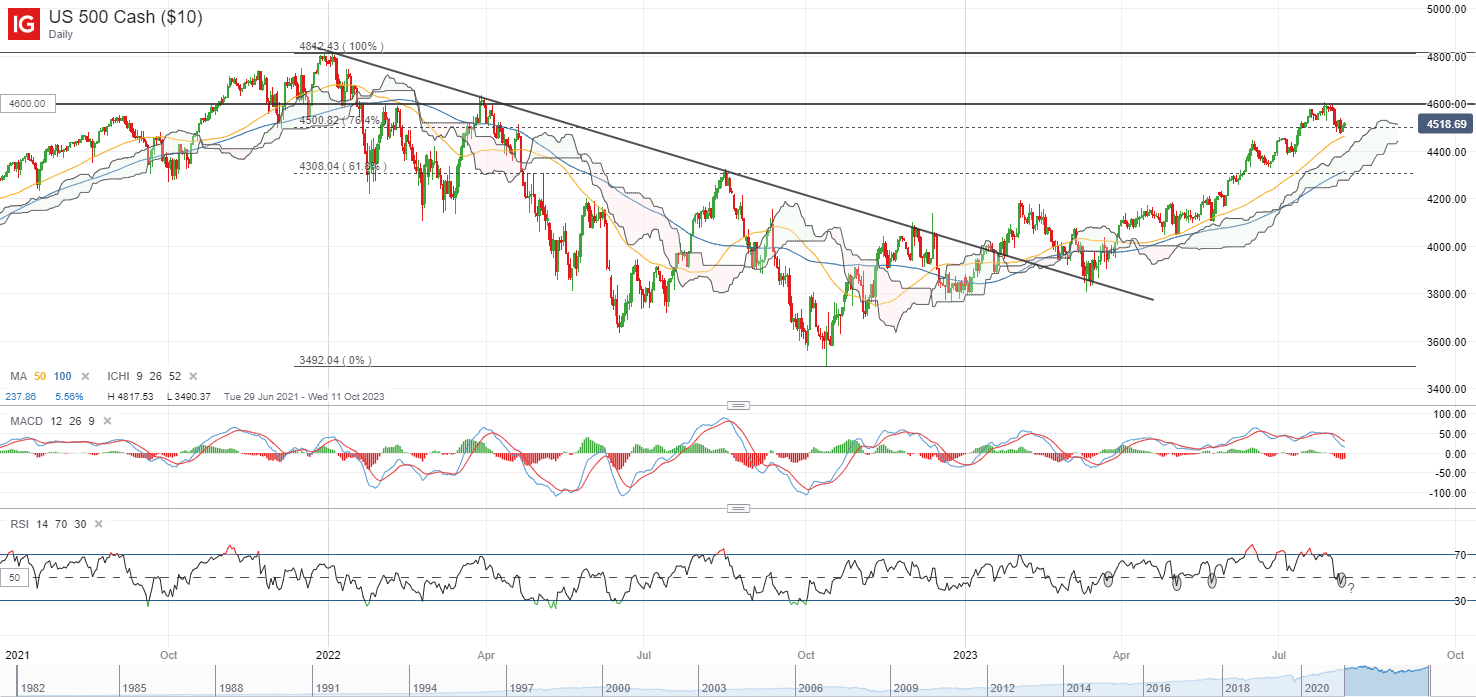
Source: IG charts
Asia Open
Asian stocks look set for a positive open, with Nikkei +0.56%, ASX +0.38% and KOSPI +0.48% at the time of writing.
Economic data this morning saw some dampener in Japan’s nominal wage growth for June (2.3% vs 3.0% consensus) and accompanied with the faster pace of increase in inflation, wages in real terms registered a deeper contraction (-1.6% versus previous -0.9%). The immediate reaction for the Japanese yen is to the downside, with market pricing for a more patient normalisation process from the Bank of Japan (BoJ). Household spending data disappoints on a year-on-year basis as well, turning in a -4.2% contraction vs the -3.9 expected. Nevertheless, continued move in wage growth above the 2% ahead could support the BoJ’s criteria of ‘sustainable wage growth’, which could see the central bank continuing its push towards normalisation, albeit through intermittent tweaks.
Ahead, China’s trade data will be in focus, with another set of subdued read as the consensus. Exports are expected to contract 12.5% from a year ago, largely unchanged from the previous 12.4% in June. Imports are expected to register its fifth straight month of year-on-year decline, with forecast at -5% versus previous -6.8%. Another weak showing may likely dampen hopes for China’s economy to turn the corner soon, which may drive a more cautious risk tone across the region, given that recent stimulus efforts from authorities have been more lukewarm.
Nevertheless, for the China A50 index, a break above its descending triangle pattern seems to suggest buyers attempting to take some control. A near-term bullish pennant formation is still in place on the daily chart, while its weekly RSI has risen above its key 50 level for the first time since February this year. Much to watch if the index could find any positive follow-through with an upward break of the pennant as a potential continuation pattern.

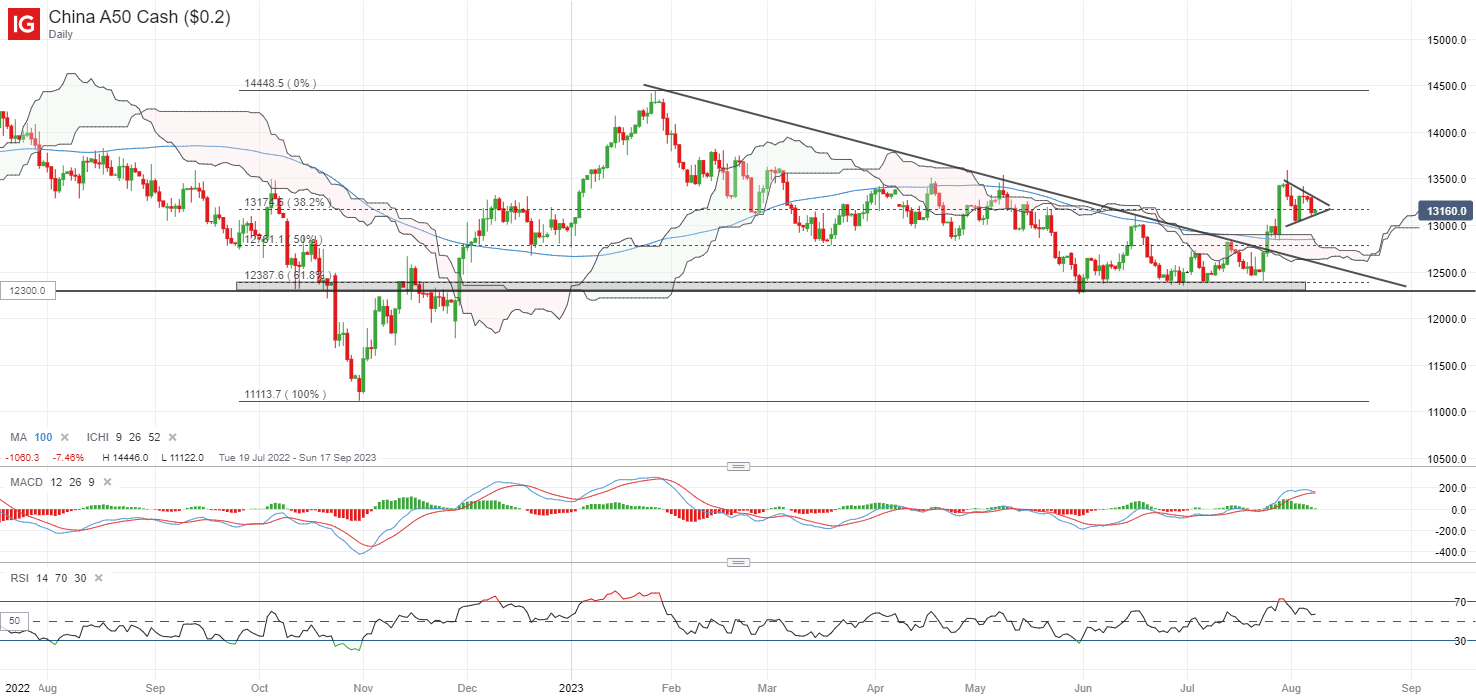
Source: IG charts
On the watchlist: Natural gas prices back on the rise
Natural gas prices continue to head higher with another 5.7% gain overnight, following through with its bounce after retesting its Ichimoku cloud support on the daily chart last week. Over the past months, prices have been attempting to build a base after its previous massive sell-off, which may suggest that much of the selling pressure could have been done for now. To recall, prices have seen a 78% sell-off since August 2022.
Recent price movement also marked the first time since September 2022 where natural gas prices are trading above its Ichimoku cloud on the daily chart, which gives some hopes of a potential trend reversal. One to watch now will be on any move in the weekly RSI back above its key 50 level. On the upside, heading above its US$2.784 level of resistance may pave the way to retest the US$3.000 level next, while the US$2.500 will serve as a crucial support to hold.
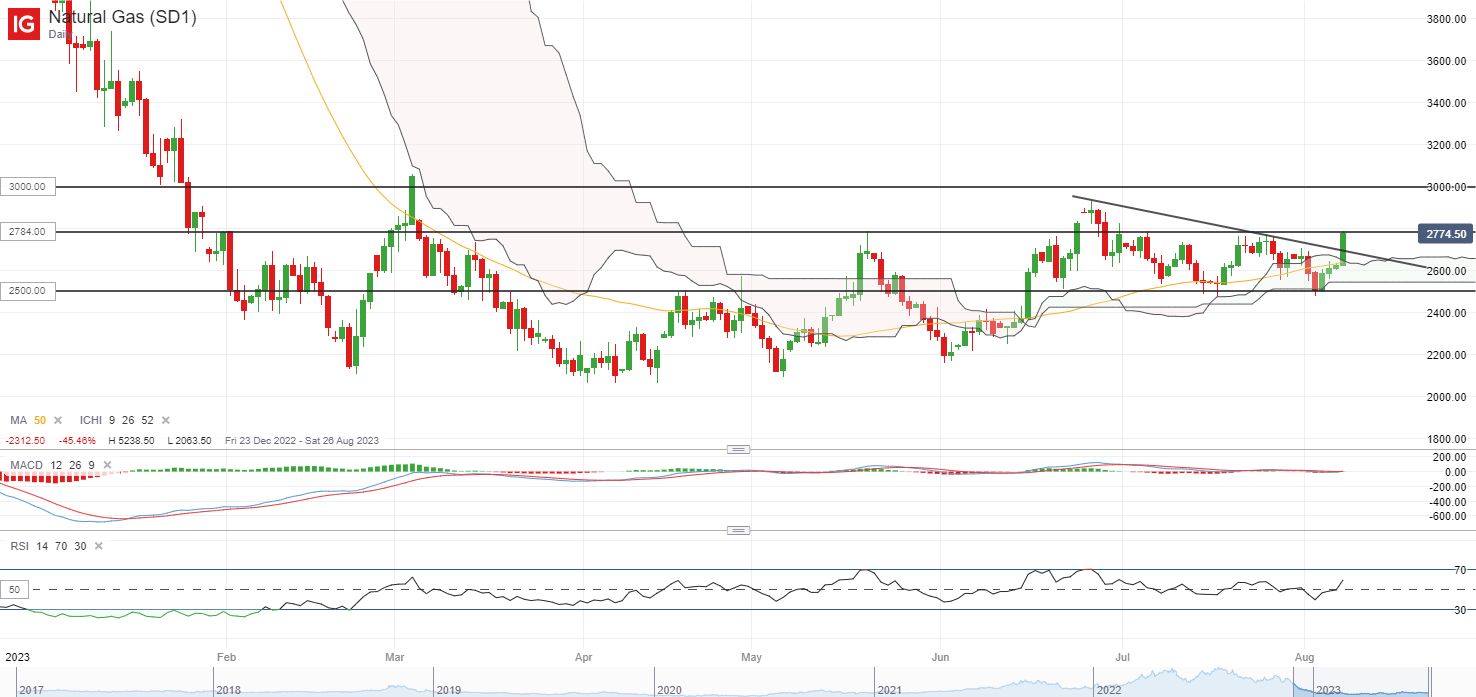
Source: IG charts
Monday: DJIA +1.16%; S&P 500 +0.90%; Nasdaq +0.61%, DAX -0.01%, FTSE -0.13%


