
US Dollar (DXY) Analysis
- US dollar basket turns at significant long-term level after yesterday’s surge
- DXY tests channel resistance as we head into the weekend with the debt ceiling issue still unresolved
- The analysis in this article makes use of chart patterns and key support and resistance levels. For more information visit our comprehensive education library

DXY Turns at Major Long-Term Support
If we are to close the week in positive territory, yesterday’s sizeable dollar surge will have done much of the heavy lifting. The weekly chart below shows the importance of the 100.85 level/zone which had come into play during the period from March to May of 2020, again in May 2022 and multiple times in 2023 already.
Despite bullish drivers of the dollar few and far between, it would appear that dollar bears require more of an external shock to get the required momentum to send the greenback lower. The two dark clouds hanging over markets at the moment are the unresolved debt ceiling issue which could go down to the wire (end of May), and the re-emergence of regional bank instability from earlier this month.
US Dollar Basket Weekly Chart
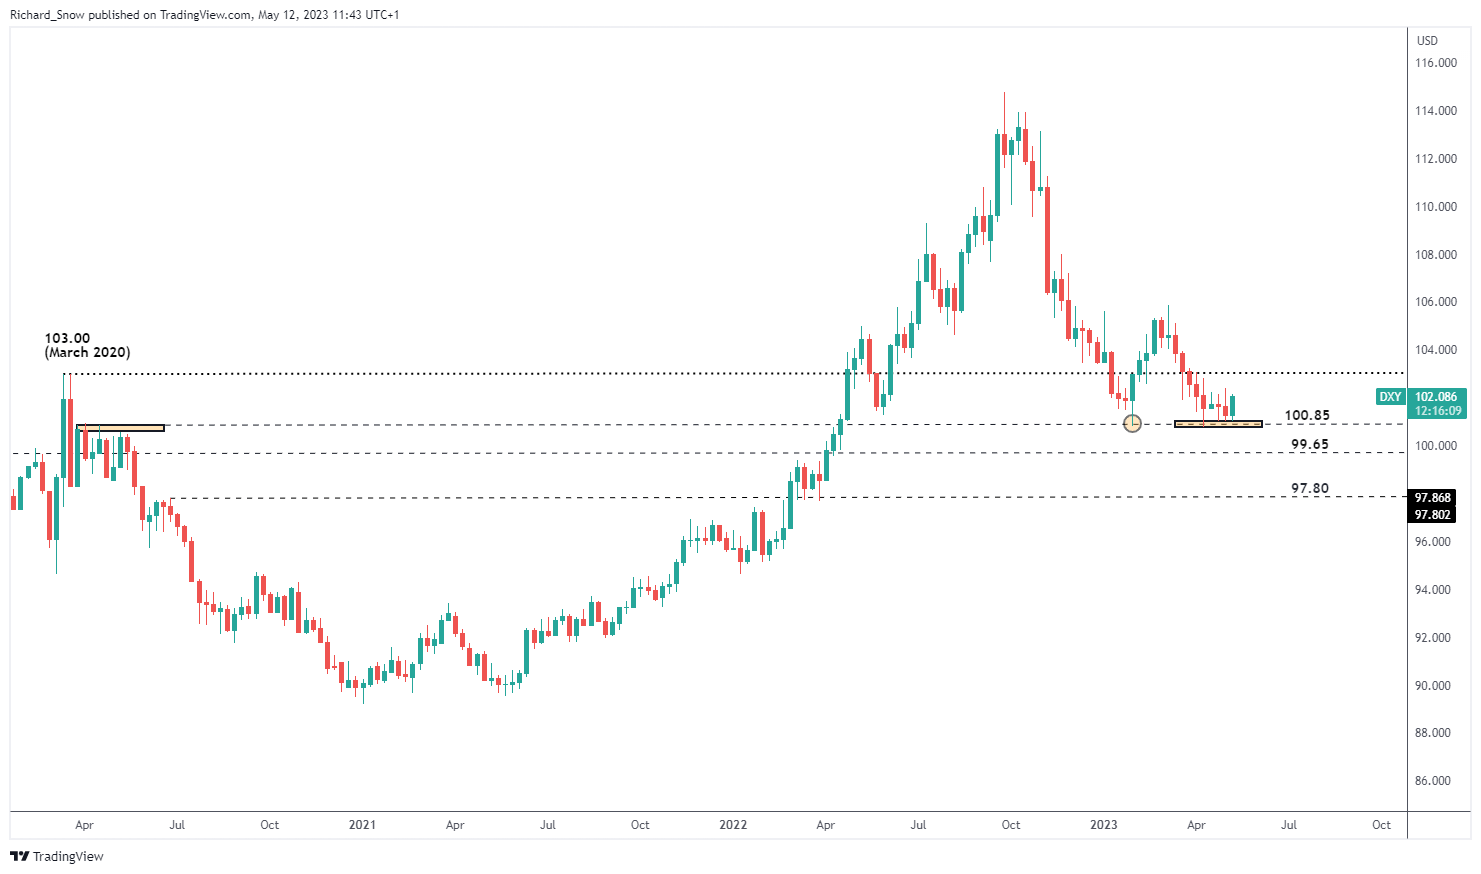
Source: TradingView, prepared by Richard Snow
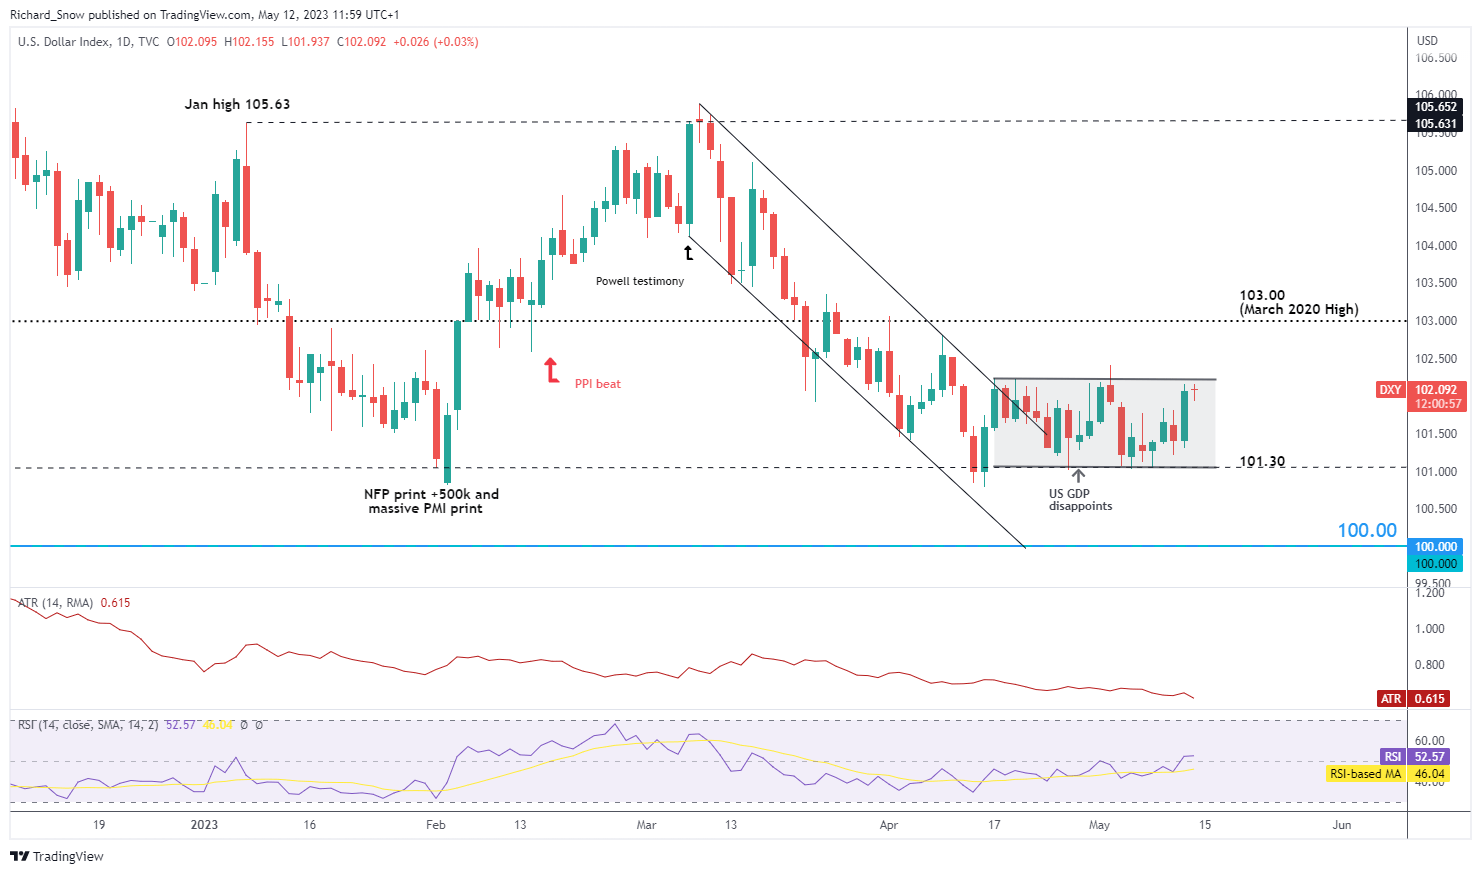
The daily chart highlights the tendency for the dollar to trade sideways ever since breaking out from the descending channel. Price action has been largely contained within the new horizontal channel as markets digest the effects of a potential interest rate pause – this is the market’s consensus view.
With prices testing the upper side of the channel, traders ought to be watchful for a breakout, or more likely, a false breakout due to reduced volatility (see the ATR indicator, the down sloping brown/red line). More volatile market conditions are typically more conducive to breakouts as it is easier to get traction. However, given the level of uncertainty around US regional banks and the US debt ceiling, sudden spurts of volatility cannot be ruled out.

Resistance lies at the upper side of the horizontal channel at 102.20 while support resides at the underside of the very same channel at 101.30/101.00.
US Dollar Basket (DXY) Daily Chart
Source: TradingView, prepared by Richard Snow
--- Written by Richard Snow for DailyFX.com
Contact and follow Richard on Twitter: @RichardSnowFX