
S&P 500 OUTLOOK:
- S&P 500 falls towards trendline support at 4,300 amid rising U.S. rates.
- U.S. Treasury yields blast higher, pushing the U.S. dollar to its strongest level since November 2022 and sparking risk off sentiment.
- This article looks at key technical levels worth watching on the S&P 500 in the coming days.
Trade Smarter - Sign up for the DailyFX Newsletter
Receive timely and compelling market commentary from the DailyFX team
Most Read: EUR/USD Sinks to Support, Hangs on For Dear Life, EUR/GBP Stuck
The U.S. dollar, as measured by the DXY index, soared on Monday, blasting past 106.80 and hitting its highest level since November 2022, boosted by soaring U.S. Treasury rates, with yields on U.S. bonds maturing between 10 and 30 years climbing to new cycle highs.
The news of the U.S. government averting a shutdown following a last-minute deal in Congress over the weekend, coupled with better-than-expected U.S. manufacturing data, led investors to infer that interest rates are likely to stay elevated for an extended period, establishing a favorable environment for the U.S. dollar and a negative backdrop for stocks.
The unhinged and drastic surge in yields ignited concerns and sparked apprehension on Wall Street, casting a shadow over risk assets. Against this backdrop, the S&P 500 edged perilously close to the 4,300 mark at one point during the trading session, coming within striking distance from its lowest level since early June.
For a longer-term view of U.S. equity indices, including the S&P 500, Nasdaq 100 and Dow Jones, download our fourth quarter trading guide. It's a valuable source for ideas and essential insights!

From a technical standpoint, the S&P 500 has descended towards trendline support at 4,300 after its recent retrenchment. If buyers are unable to counteract the downward pressure and this floor gives way, the equity benchmark could decline towards the lower boundary of a short-term descending channel at 4,265. On further weakness, the focus shifts to the 200-day simple moving average.
On the flip side, if the S&P 500 finds stability and regains its footing, buying interest could begin to gather pace, leading to an upward journey towards 4,370. While this area might present resistance, a breakout has to potential to push prices towards 4,435, followed by 4,500. However, with US yields at multi-year highs, the path of least resistance may be lower going forward.
S&P 500 TECHNICAL CHART
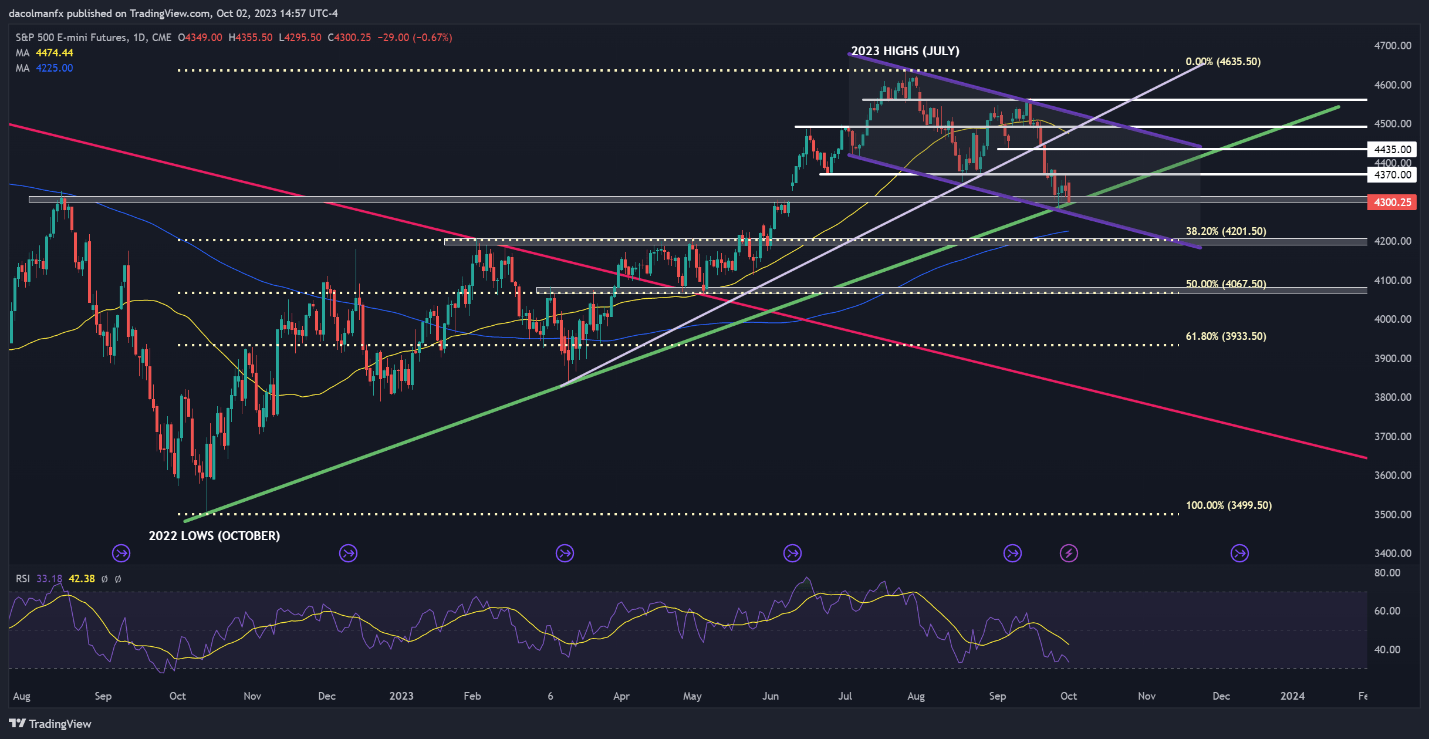
S&P 500 Futures Chart Created Using TradingView
If you're puzzled by trading losses, why not take a step in the right direction? Download our guide, "Traits of Successful Traders," and gain valuable insights to steer clear of common pitfalls that can lead to costly errors.