


Market Recap
Wall Street started the new trading week on a positive footing, as risk appetite rose ahead of several key earnings releases this week, single-handedly uplifted by the technology (+1.3%) and financial (+1.0%) sectors. A surprise expansion in the New York Empire State Manufacturing Index (1.1 versus -4.3%) overnight added to the list of positive surprises thus far in pushing back against recession concerns, further validated by comments of a no-recession from US Treasury Secretary Janet Yellen. The US economic surprise index has touched its highest level since March 2021.
While the collapse of the Ukraine grain deal overnight may raise the risks of more persistent food prices by restricting global food supplies, sentiments seem to be taking it in stride for now, potentially as moderating pricing pressures across the globe has been more broad-based.
The US retail sales will be in focus today, with resilience still the story as expectations look for a 0.5% month-on-month gain, up from the 0.3% in May. Likewise, industrial production is expected to show an uptick from May, heading to 1.1% from a year ago compared to the 0.2% in May.
Perhaps one to watch will be Brent crude prices, which saw a negative reaction to China’s lackluster GDP data yesterday on a potentially weaker oil demand outlook. That said, having broken above a near-term consolidation last week, prices are back to retest a previous resistance-turned-support at the US$78.40 level, where its key 100-day moving average (MA) stands as well. Any formation of a new higher low will be on watch to provide some conviction for a continuation of the near-term upward bias.
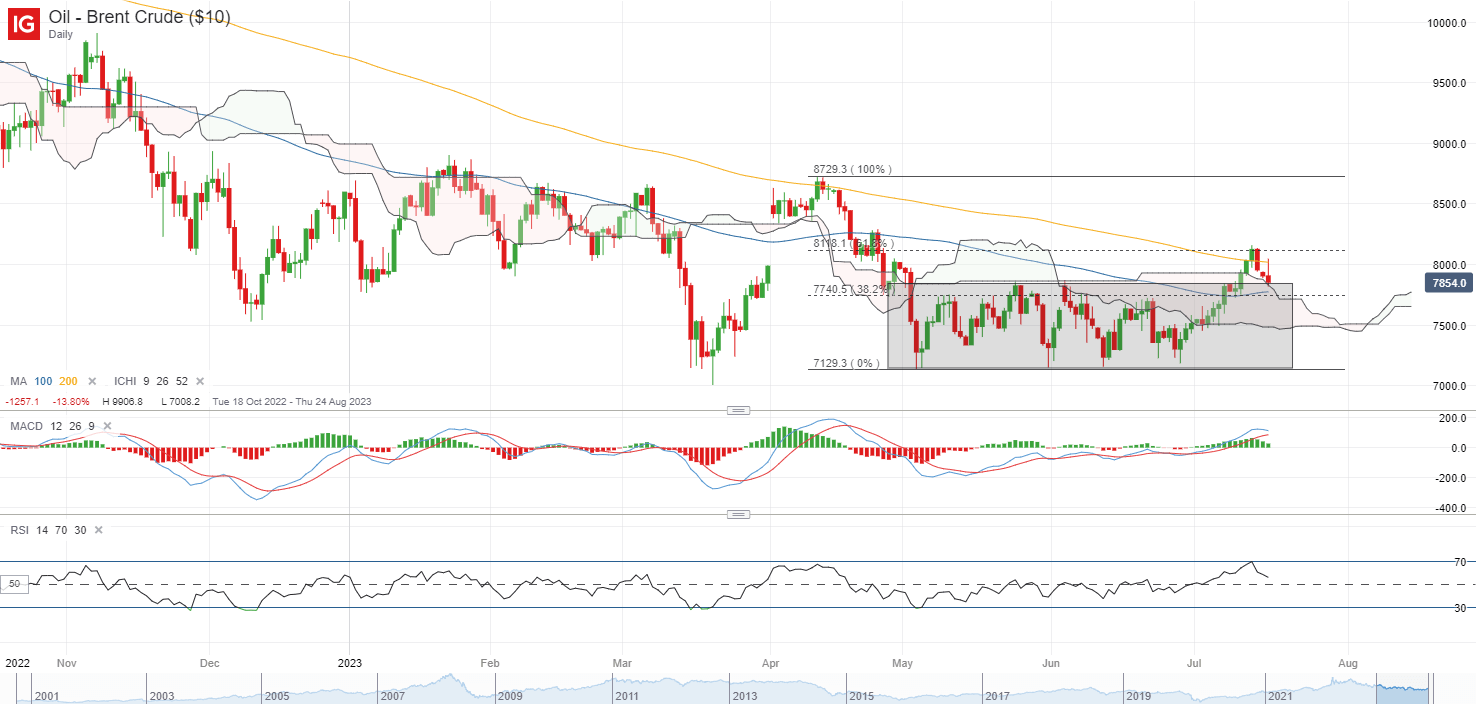
Source: IG charts
Asia Open

Asian stocks look set for a mixed open, with Nikkei +0.81%, ASX -0.19% and KOSPI -0.31% at the time of writing. After being back online from its holiday break, the Nikkei is riding on the strength in Nasdaq for some gains to start the week, as buyers seek to overturn the double-top formation on the daily chart. A reclaim of its 20-day MA may provide greater conviction, but for now, the 32,700 level stands as immediate resistance to overcome.
The light economic calendar in Asia will put the Reserve Bank of Australia (RBA) meeting minutes on the radar, with the minutes closely watched for clues on the potential for a rate hike at the upcoming meeting in two weeks. The RBA has previously showed their intent for some wait-and-see by keeping rates on hold, but rate expectations remain unconvinced for an extended pause by leaning slightly towards another 25 basis-point hike by October this year. Therefore, views from policymakers will be sought from the minutes to anchor down some expectations.
For the AUD/JPY, a recent retest of its previous support-turned-resistance at the 95.34 level was marked with some resistance, with lower highs on Relative Strength Index (RSI) pointing to some moderating upward momentum. Perhaps greater conviction for the bulls will depend on any move back above the key resistance of 95.34 level. On the downside, the 93.25 level could be on watch for near-term support. This level marked a 38.2% Fibonacci retracement level, in confluence with an upward trendline support and its Ichimoku cloud (daily).
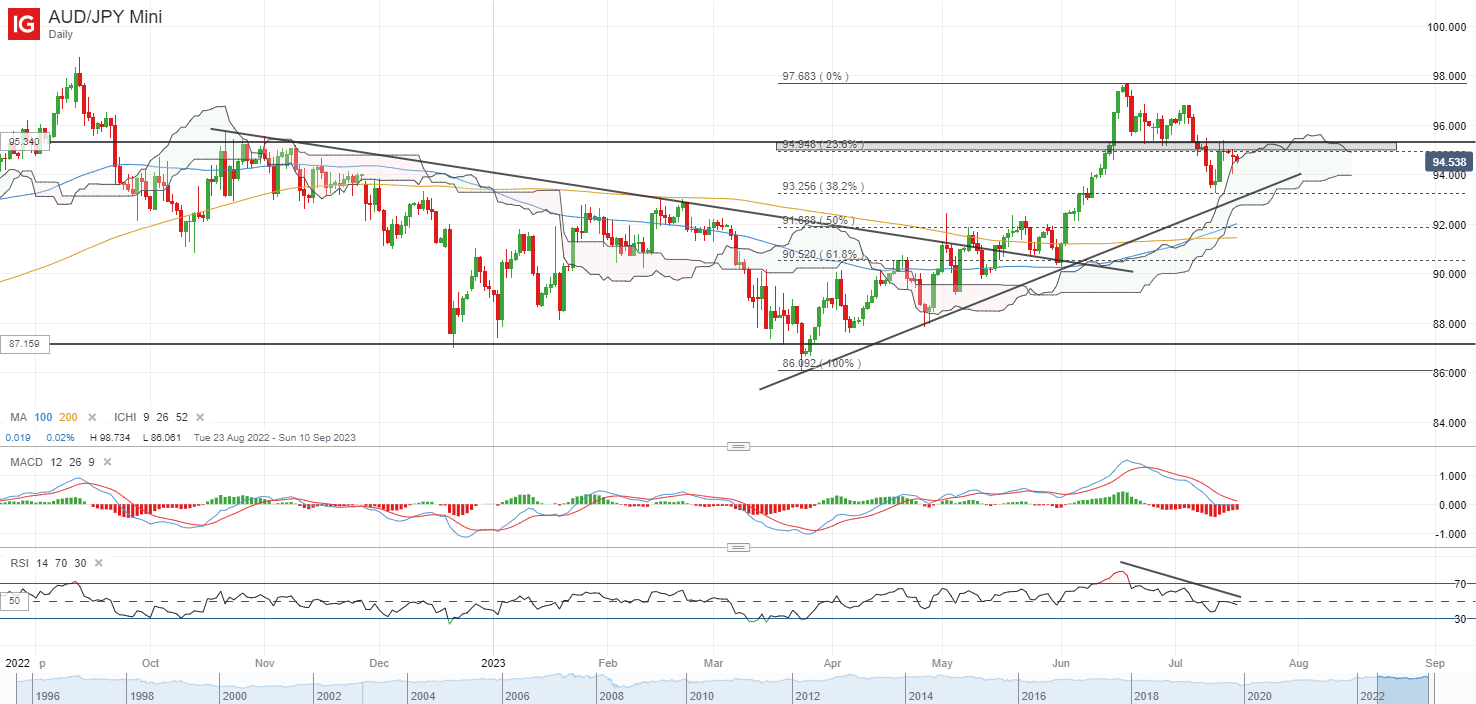
Source: IG charts
On the watchlist: Natural gas prices hanging at neckline of minor head-and-shoulder formation
Recovering natural gas supply has prompted prices to take a dip lately to its one-month low, with a close to 14% retracement from its recent June 2023 peak. For now, the daily chart seems to display a minor head-and-shoulder formation, as buyers are attempting to defend the neckline around the 2.530 level. Much still awaits with a series of spinning tops pointing to some near-term indecision.
Any subsequent breakdown of the neckline could potentially pave the way to retest the 2023 bottom at the $2.100 level, given the price projection from the height of the pattern. The current $2.530 level also marked its 50-day MA while the RSI hovers slightly below the key 50 level. On the upside, the $2.784 will serve as immediate resistance to overcome.
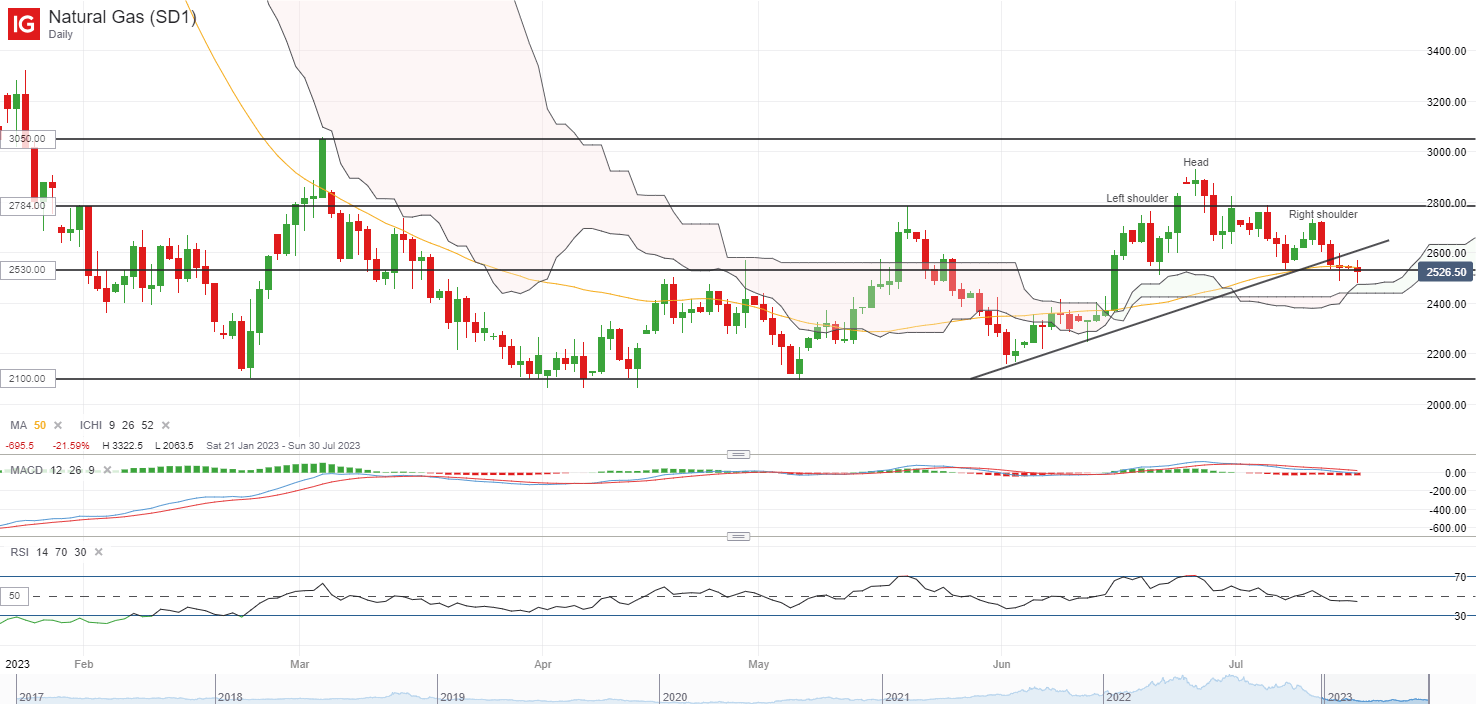
Source: IG charts
Monday: DJIA +0.22%; S&P 500 +0.39%; Nasdaq +0.93%, DAX -0.23%, FTSE -0.38%
Trade Smarter - Sign up for the DailyFX Newsletter
Receive timely and compelling market commentary from the DailyFX team


