


S&P 500, Nasdaq Weekly Forecast: Bullish
- US equities surge higher despite hotter NFP print, possibly buoyed by stable average hourly earnings and rise in the unemployment rate
- S&P 500 ends the week on a high with 4325 in sight. Only 29 firms currently outperform the index
- Nasdaq trending higher and in danger of overheating at such extended levels
- The analysis in this article makes use of chart patterns and key support and resistance levels. For more information visit our comprehensive education library

US Stocks Surge Despite Hotter NFP Print
US equities continue to defy logic, rising higher and higher led by a handful of technology stocks and more recently AI-related stocks. During this last week the Fed provided equity markets with a nice tailwind as Patrick Harker and Philip Jefferson signaled their preferences for a “skip” at this month’s FOMC meeting. In addition, any lingering concerns weighing on risk markets dissipated as a bipartisan agreement to suspend the debt ceiling was achieved at the eleventh hour.
Then on Friday, NFP data provided another reminder of the resiliency of the US labour market as the month of May brought in 339k jobs in contrast with the median economist expectations of 190k. April’s figure of 253 was also revised higher to 294k. A tight jobs market suggests the Fed’s efforts to calm inflation is far from over, which suggests the committee could be swayed to hike once again this month. The dollar traded higher in the moments after the NFP data was revealed and tends to negatively impact indices – not the case on Friday. Market participants may be choosing to focus on the fact that average hourly earnings failed to move higher and the unemployment technically moved higher despite the job additions.
The market cap weighted index continues to be dominated by moves in high market cap tech stocks while the majority of the index hasn’t been faring all that well. The chart below helps make this point by showing the number of companies that are outperforming the S&P 500 index. With the current reading at 29, it is lower than during the Covid period, 2008 and only slightly above the level observed in the leadup to the dotcom bubble.
Percentage of Companies Outperforming the S&P 500 Index

prepared by Richard Snow
S&P 500 Technical Analysis
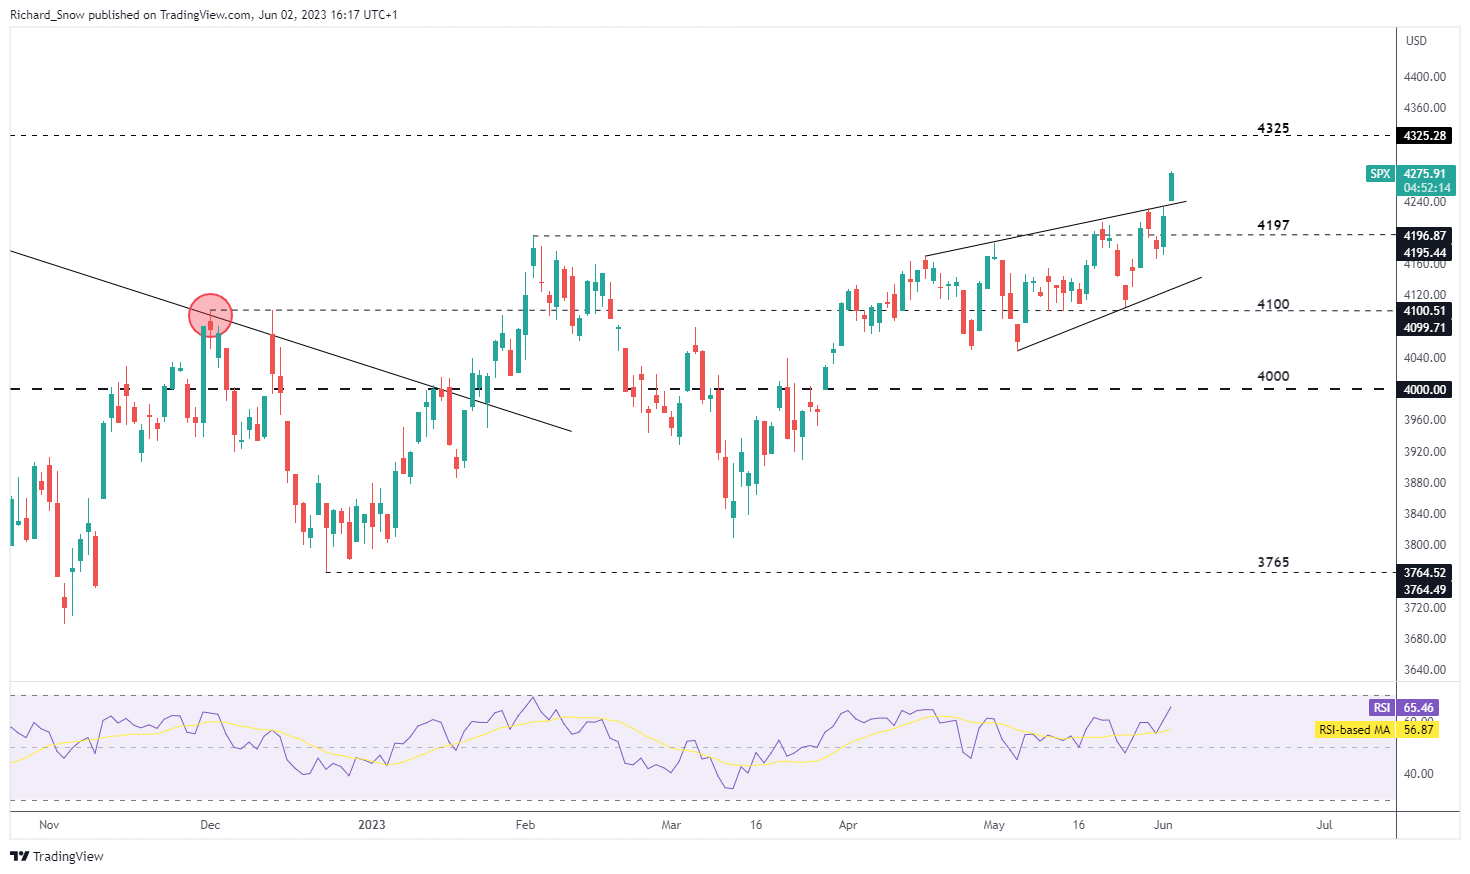
The S&P 500 index broke above the rising wedge on Friday before the close after gapping higher at the open. Price action had previously shown a reluctance to break higher and only managed a gradual grind higher until today’s advance. The RSI shows a move towards overbought territory which suggests there could still be room for a continuation of the latest impulse.
The move has the market in some clear air it would seem, with the August 2022 high of 4325 the next level of resistance for the index. Naturally, support resides at prior resistance at 4196/4200.
S&P 500 Daily Chart
Source: TradingView, prepared by Richard Snow
The weekly chart helps to view the broader uptrend which had struggled to show a preference for a strong directional move. The current bull trend originated in the latter stages of last year, attempting to retrace the major selloff that ensued over much of 2022.
S&P 500 Weekly Chart

Source: TradingView, prepared by Richard Snow

The chart below shows how a handful of mega-cap stocks have been dragging indices higher, particularly Nvidia which has recently achieved the milestone of a 1 trillion dollar market cap as AI technology projects boom. Meta has also put in a decent showing although it has risen off a low base amid PR challenges and massive capital expenditure on its metaverse. Currently, all FAANG + Microsoft, Tesla and Nvidia have performed better than the index itself.
Mega-cap Tech Stocks Performance YTD

Source: Refinitiv, prepared by Richard Snow
Nasdaq 100 Technical Analysis
The Nasdaq chart, like the S&P 500 put in a decent move higher to end the week near the 14,500 mark although it appears to have risen to a lesser degree than SPX and that could be due to its parabolic rise rendering it in overbought territory (RSI). The index embarked on another leg higher after breaking out of the channel of consolidation which developed throughout April and early May.
The steepness of the move now sees the Nasdaq breaching well into overbought levels where market participants will be keeping an eye on a potential pullback in the event traders decide to reduce their exposure at such elevated levels. Resistance appears at 15,260 which corresponds with the Feb and March 2022 highs. Immediate support naturally becomes the 23.6% Fibonacci retracement of the major 2020 to 2021 move.
Nasdaq Futures (NQ1!) Daily Chart

Source: TradingView, prepared by Richard Snow
--- Written by Richard Snow for DailyFX.com
Contact and follow Richard on Twitter: @RichardSnowFX


