Article written by IG Senior Market Analyst Axel Rudolph
FTSE 100, DAX 40, S&P Analysis and Charts
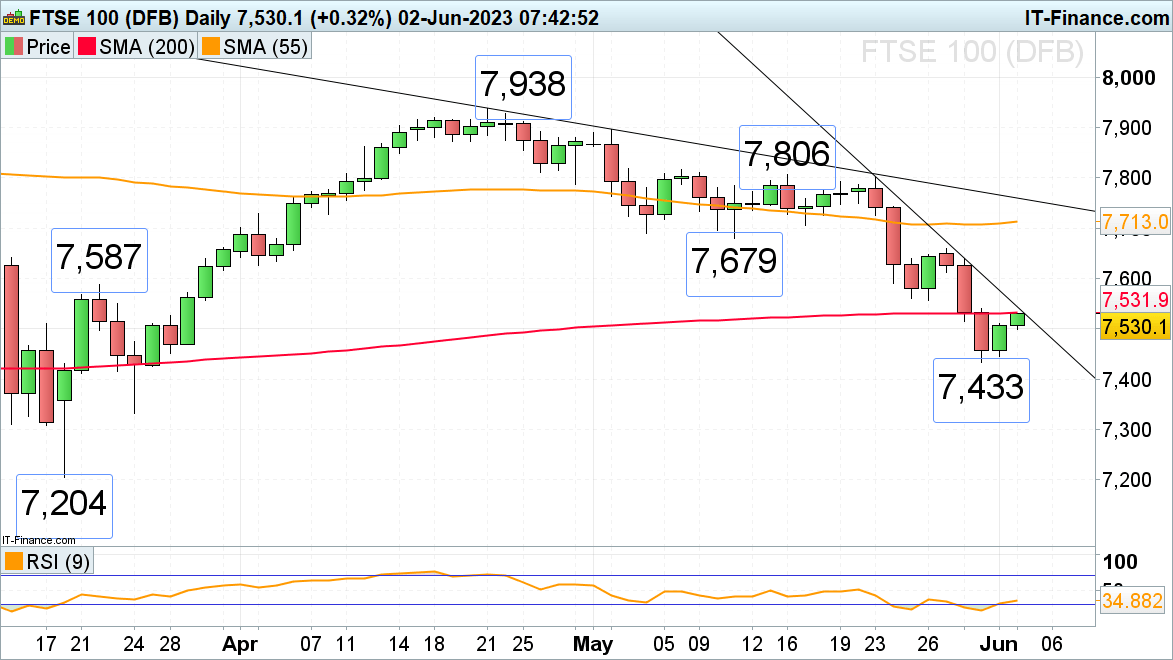
FTSE 100 recovers as US avoids a default
The FTSE 100 is seen bouncing off its two-month low at 4,433 on the back of rallying Asian markets as the US Senate passed the debt ceiling deal which now only needs to be signed into law by President Biden.
The index thus retests its 200-day simple moving average (SMA) at 7,532, a rise above which would engage last week’s low at 7,556 and also the 7,587 22 March high.
For the bulls to be back in control, last week’s high at 7,660 would need to be overcome on a daily chart-closing basis.
Key short-term support sits at this week’s low at 7,433, a currently unexpected drop through which would target the early January low at 7,412. Below it the December and 24 March lows can be spotted at 7,331 to 7,296.
FTSE 100 Daily Price Chart

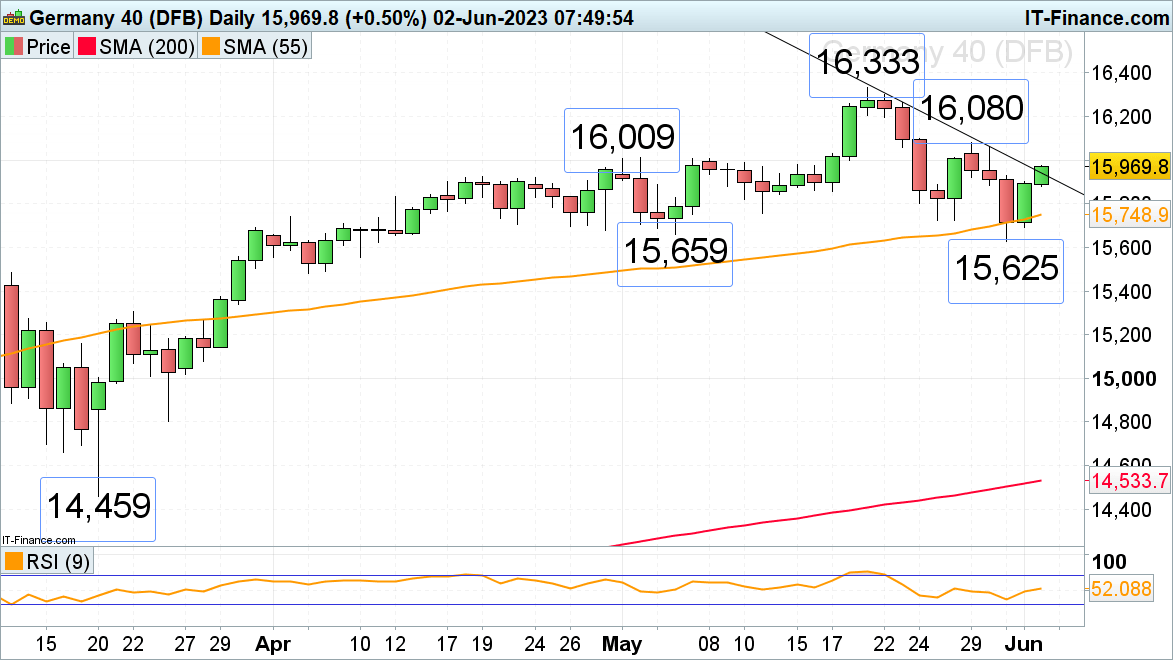
DAX 40 rallies on positive news out of the US
The DAX 40 revisited its 55-day simple moving average (SMA) at 15,748 as US ADP employment data came in much stronger-than-expected but then bounced off it as the Senate agreed to the debt ceiling deal.
The German stock index is seen breaking through its May-to-June uptrend line at 15,940. It thus targets the early May high at 16,009, followed by last week’s high at 16,080. This level would need to be exceeded for the bulls to be back in the frame.
Support below Friday’s 15,880 intraday low sits at the 15,723 late May low.
DAX 40 Daily Price Chart
Trade Smarter - Sign up for the DailyFX Newsletter
Receive timely and compelling market commentary from the DailyFX team
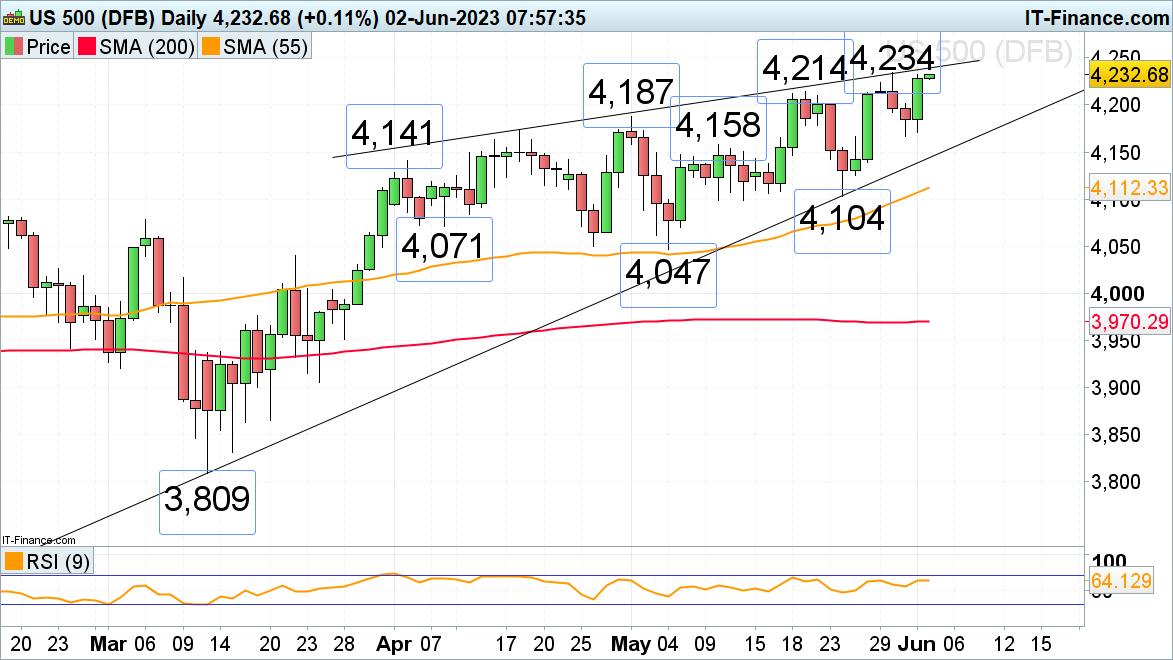
S&P 500 rallies as the US debt ceiling deal is signed off
The S&P 500 rallies back to this week’s high at 4,234 as a US debt ceiling deal has been reached. Above this level lies the August 2022 peak at 4,325.
Slips should find support between the 4,187 early May high and the 10 May high at 4,158. Within this area lies this week’s low at 4,167.
S&P 500 Daily Price Chart