


Oil (Brent Crude, WTI) Analysis
- US API crude inventory data posts sizeable rise, EIA data delayed to next week
- Oil sell-off sees the commodity (Brent) trading below the key 200 SMA
- WTI trading in a similar fashion with the 200 SMA holding as resistance
- The analysis in this article makes use of chart patterns and key support and resistance levels. For more information visit our comprehensive education library

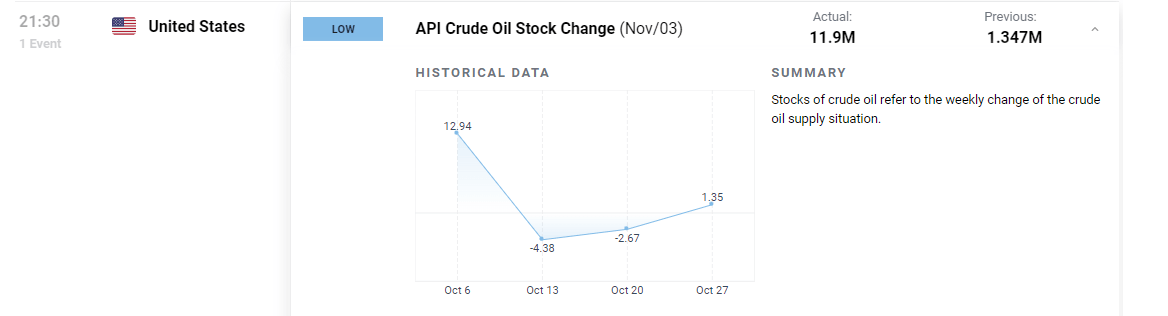
US Crude Inventory Data Posts Sizeable Rise
The American Petroleum Institute (API) reported a sizable rise in US crude stocks for the week ending 3 November. The inventory build has weighed on oil prices which have already suffered amid the prospect of a continued growth slowdown in the world's major economies.
The data comes in a week where the Energy Information Agency (EIA) we'll delay the release of its storage data as it undergoes systems maintenance. rising inventory levels combined with weaker anticipated oil demand weighs on oil.
Customize and filter live economic data via our DailyFX economic calendar
Oil Sell-off Sees the Commodity Trading Below the Key 200 SMA
Brent crude oil plunged 4.4% yesterday taking out the prior swing low at 83.50, the 200-day simple moving average (SMA) and the $82 mark. Yesterday's strong move serves to reinforce the existing bearish trend that has ensued after the market topped on the 19th of September this year.
Oil markets have opened slightly lower in the European session somewhat confirming the recent bearish sentiment. The RSI indicator approaches over sold territory suggesting there is still further room to the downside before a potential pullback becomes more likely.
It would appear that the war premium and concerns over oil supply in the broader region have dissipated while global growth concerns amid elevated interest rates, continue to be the domineering factor in the price discovery process. Additionally, positive import data for the month of October in China highlighted an uptick in Chinese oil imports compared to October of 2022 but when one considers the world's second largest economy was enduring continued lockdowns at the time, the 13.5% rise (year on year) looks a lot less impressive.
The next level of support appears at $77 which is the 50% retracement of the broader 2020 to 2022 move. Immediate resistance appears at the $82 mark which coincides roughly with the 200 SMA. a successful test of this level with prices subsequently moving lower would not bode well for oil bulls.
Brent Crude Oil Daily Chart
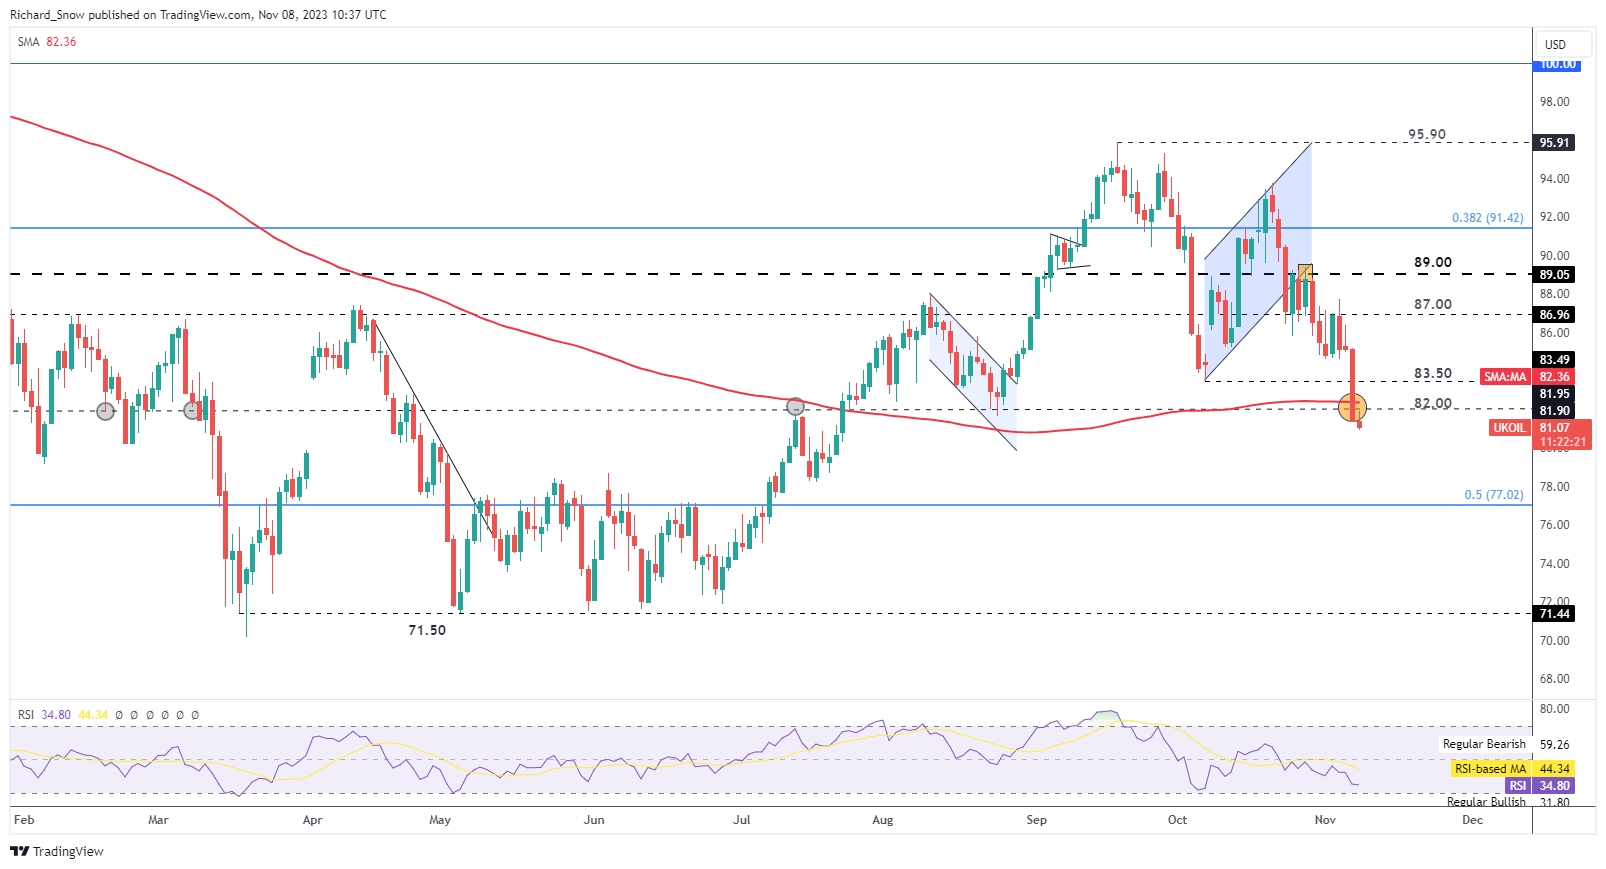
Source: TradingView, prepared by Richard Snow

The Brent crude weekly chart shows the massive decline and turn around in oil prices, revealing 3 relatively large red candles one after the other with oil prices dropping more than $11 in the space of under three weeks.
Brent Crude Oil (CL1! Continuous futures) Weekly Chart
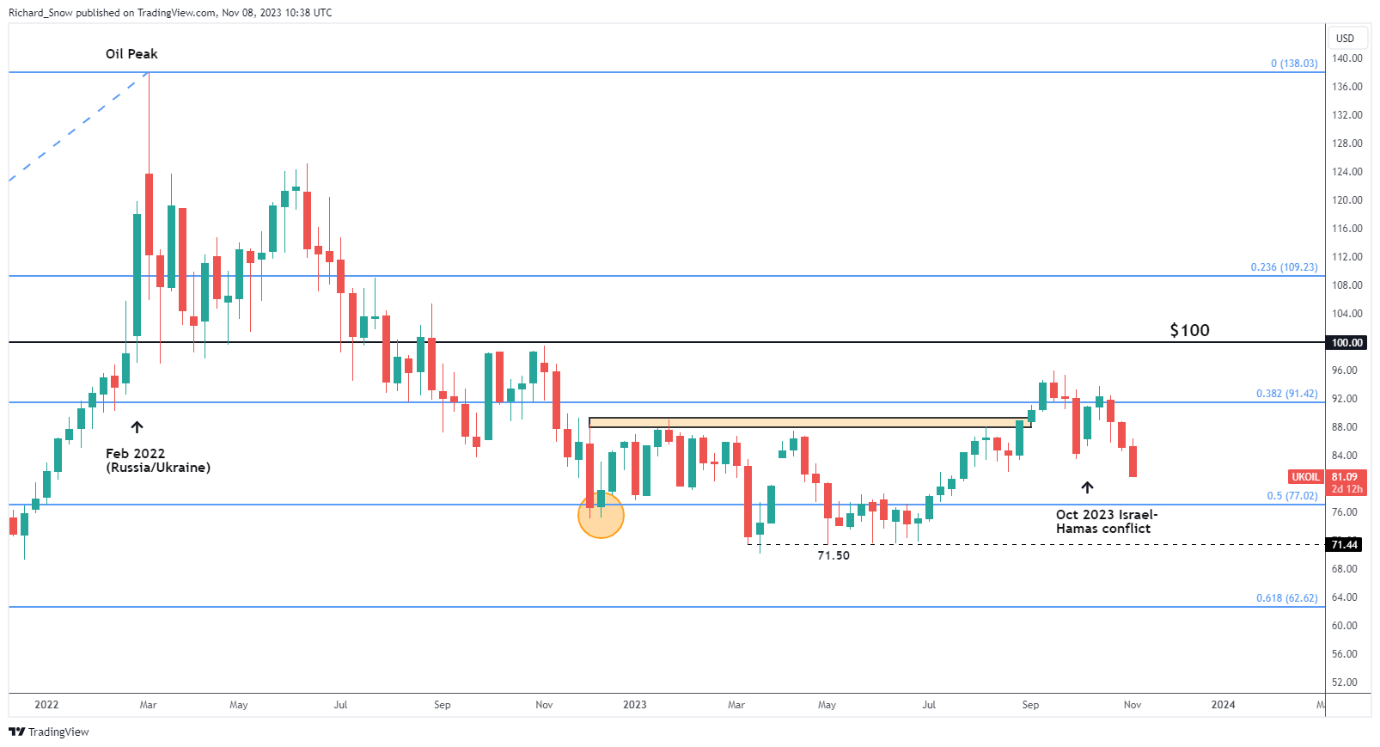
Source: TradingView, prepared by Richard Snow
US WTI oil sinks lower, trading beneath the 200 SMA
Similarly to Brent crude oil, WTI has broken beneath the 200 SMA and the rather important long term level of $77.40 during the latest decline. The next level of support appears at $72.50 with resistance close by at $77.40 and the 200 SMA slightly above that level.
US Crude (WTI) Daily Chart
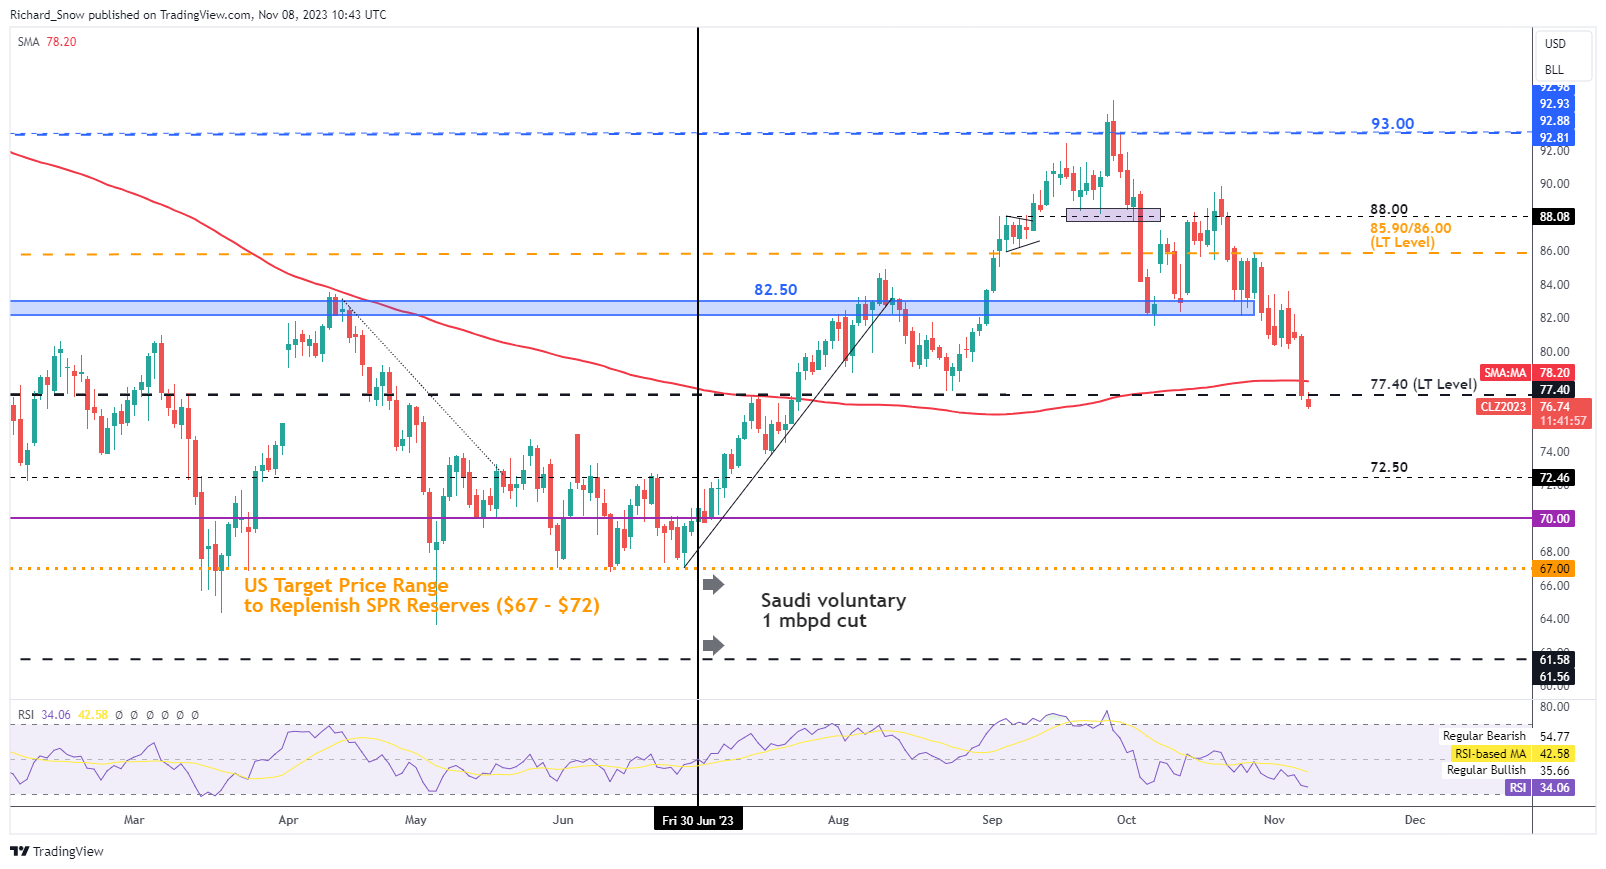
Source: TradingView, prepared by Richard Snow
--- Written by Richard Snow for DailyFX.com
Contact and follow Richard on Twitter: @RichardSnowFX


