
Gold, XAU/USD, Silver, XAG/USD – Outlook:
- Precious metals have soared on geopolitical concerns.
- Both gold and silver are testing major resistance.
- What is the outlook and what are the key levels to watch in XAU/USD and XAG/USD?
Looking for actionable trading ideas? Download our top trading opportunities guide packed with insightful tips for the fourth quarter!

Is the worst over for gold and silver? Probably not.
Potential safe-haven bids and short-covering on escalating tensions in the Middle East have boosted gold this month. Dovish comments by US Federal Reserve officials suggesting that the US central bank has pivoted on rates is also supporting the yellow metal. In this regard, the key focus is on Fed Chair Powell’s speech later this week. The market is pricing in around a 90% chance that the Fed will keep interest rates unchanged at its Oct. 31-Nov. 1 meeting.
While heightened geopolitical uncertainty could keep precious metals well bid, unless the broader trajectory of US Treasury yields/real yields reverse, the path of least resistance for gold remains sideways to down. Geopolitics is one of the risks that could slow or reverse the slide in the yellow metal, as highlighted in the quarterly outlook. “Gold Q4 Fundamental Forecast: Weakness to Persist as Real Yields Rise Further,” published October 6, and “Gold/Silver Q4 Technical Forecast: Tide Remains Against XAU/USD & XAG/USD,” published October 1.
XAU/USD Daily Chart
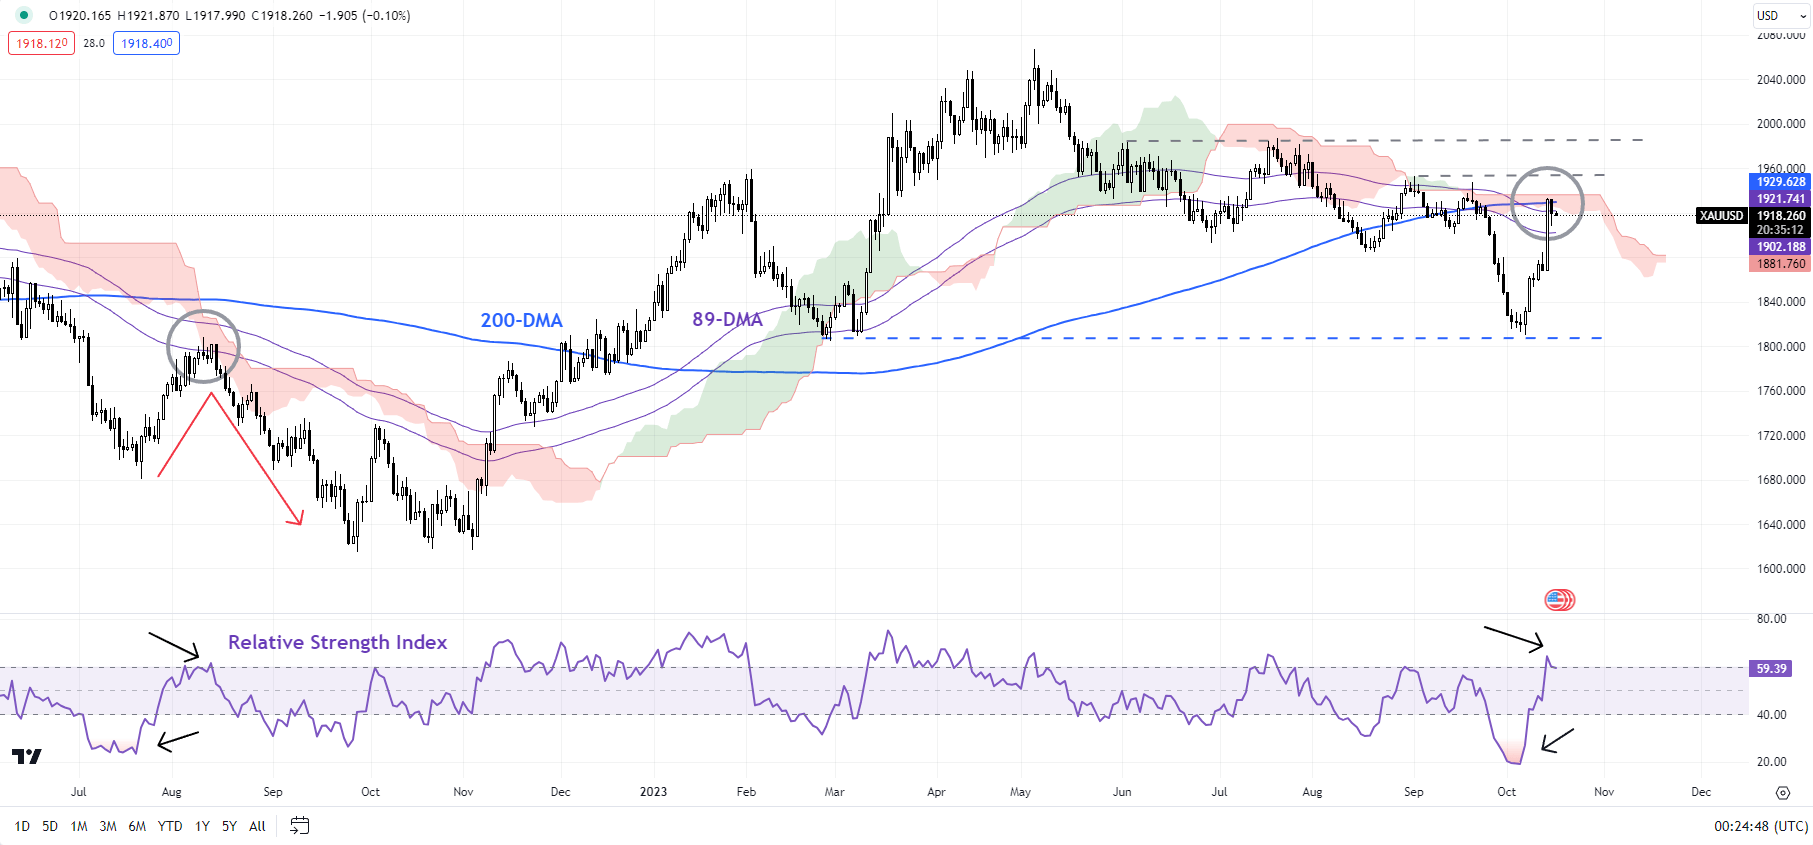
Chart Created by Manish Jaradi Using TradingView
Gold: Rally hits a roadblock
On technical charts, gold has run into significant converged resistance at the September high of 1953, the 89-day moving average, the 200-day moving average, and the upper edge of the Ichimoku cloud on the daily charts. Despite the rebound, the 14-Relative Strength Index (RSI) was unable to clear 60-65, suggesting that the rally in recent sessions isn’t the start of a new trend.
Elevate your trading skills and gain a competitive edge. Get your hands on the U.S. dollar Q4 outlook today for exclusive insights into key market catalysts that should be on every trader's radar.

XAU/USD Weekly Chart
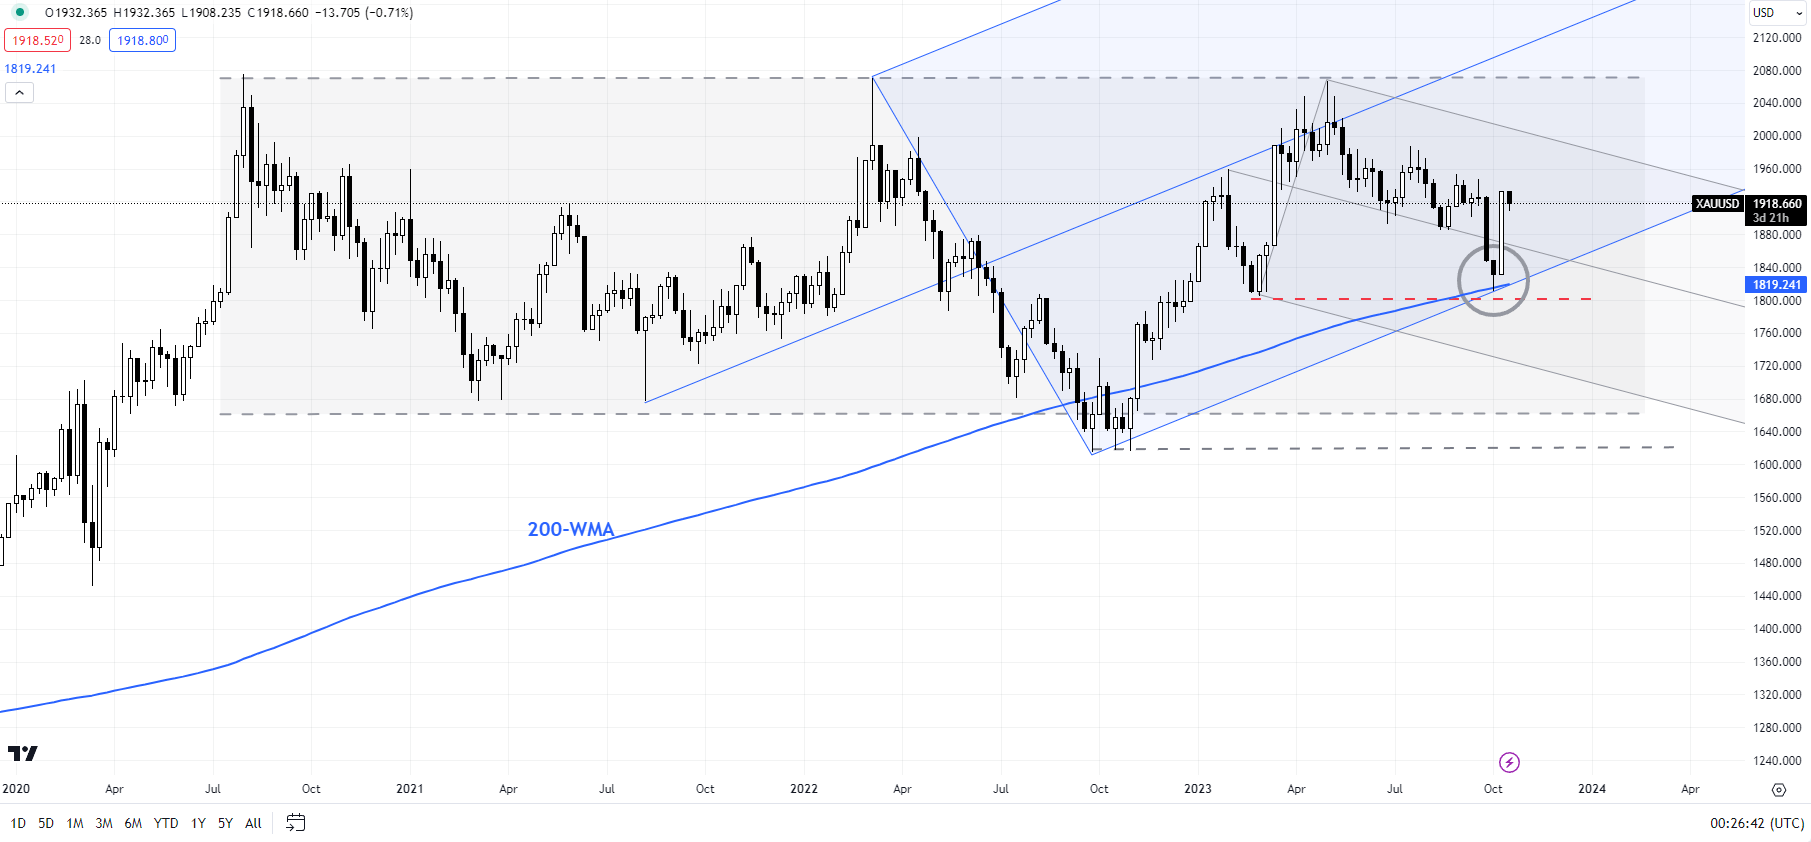
Chart Created by Manish Jaradi Using TradingView
That’s because the rebound since early October looks similar to the one in mid-2022. Deeply oversold conditions (RSI below 20) triggered a rebound toward the 89-day moving average and the cloud. Gold subsequently made a new low a few months later. Any break below Monday’s low of 1905 would indicate that the upward pressure since last week had faded.
On the upside, as mentioned in the quarterly outlook, XAU/USD needs to rise abovethe July high of 1987 for the immediate downside risks to dissipate. Furthermore, a crack above the May high of 2072 is needed for the outlook to turn bullish.
XAG/USD Daily Chart
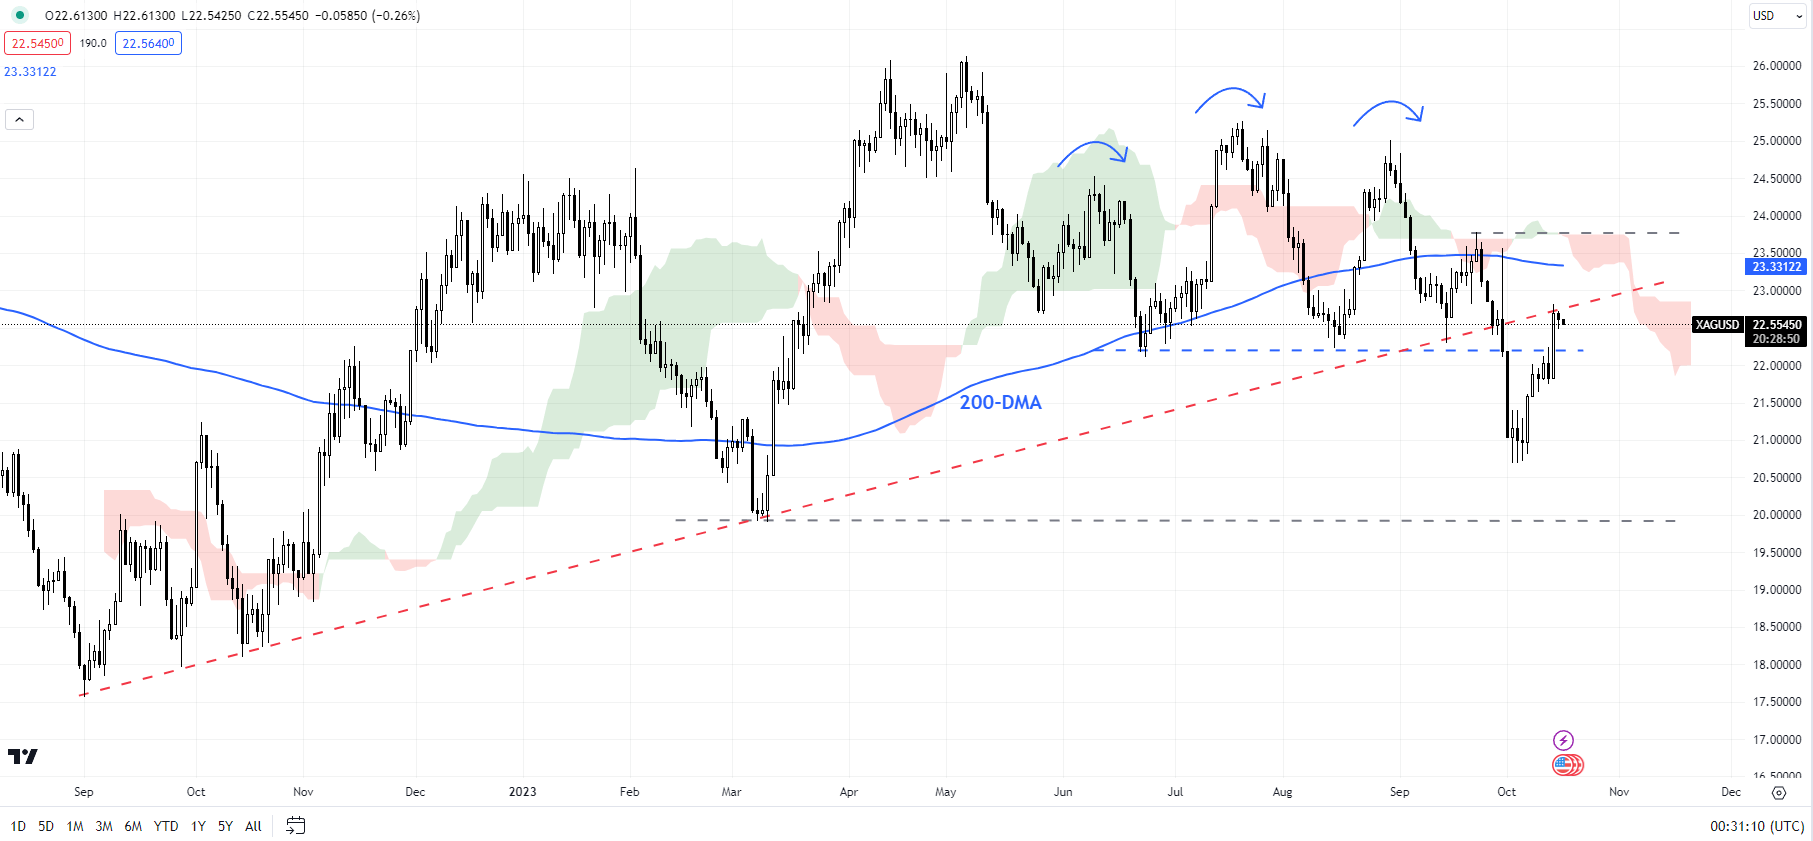
Chart Created by Manish Jaradi Using TradingView
Silver: Yet to break significant resistance
Silver’s rebound has run into stiff resistance on an uptrend line from late 2022, slightly above the support-turned-resistance at the August low of 22.20. Above this, there is a major converged hurdle on the 200-day moving average, the late-September high of 23.75, and the upper edge of the Ichimoku cloud on the daily charts. XAG/USD needs to cross the 23.25-23.75 area for the immediate downward pressure to fade.
From a slightly broader perspective, as highlighted in the Q4 outlook, XAG/USD needs to cross above 25.50-26.25 resistance for the outlook to turn constructive. See “Gold Q4 Fundamental Forecast: Weakness to Persist as Real Yields Rise Further,” published October 6, and “Gold/Silver Q4 Technical Forecast: Tide Remains Against XAU/USD & XAG/USD,” published October 1.
Any fall below Monday’s low of 22.50 could open the door toward Thursday’s low of 21.75. Next support is at the early-October low of 20.50, followed by stronger support at the March low of 19.85.
Curious to learn how market positioning can affect asset prices? Our sentiment guide holds the insights—download it now!

--- Written by Manish Jaradi, Strategist for DailyFX.com
--- Contact and follow Jaradi on Twitter: @JaradiManish