


Gold (XAU/USD) Analysis, Prices, and Charts
- US inflation report the next driver for gold’s price action.
- The 200-day simple moving average provides short-term support.
Learn How to Trade Gold with our Complimentary Guide

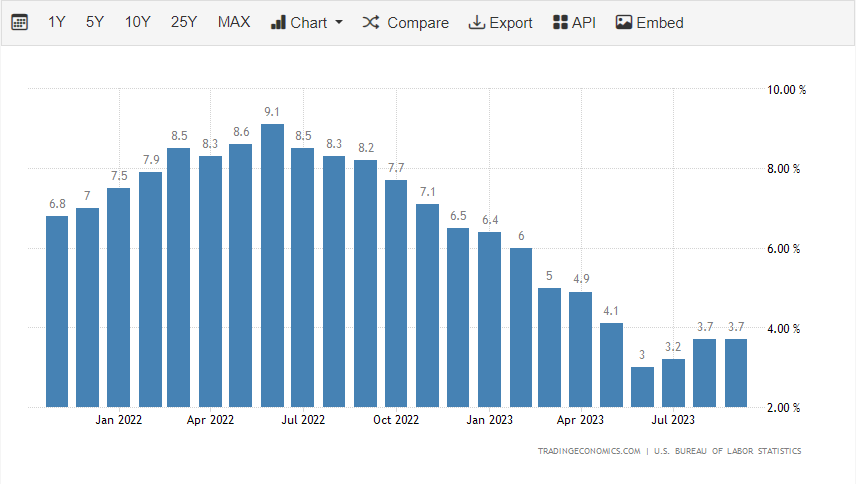
The latest US inflation report is released at 13:30 GMT today and is expected to show y/y core inflation remaining unchanged at 4.1%, while the annual headline reading is seen falling to 3.3% from 3.7% in September. Headline inflation has fallen sharply from a peak of 9.1% in June last year but has picked up from this June’s low of 3%. Fed Chair Jerome Powell will be hoping that inflation resumes its move lower, despite his recent warning that not enough was being done to bring inflation down to target.

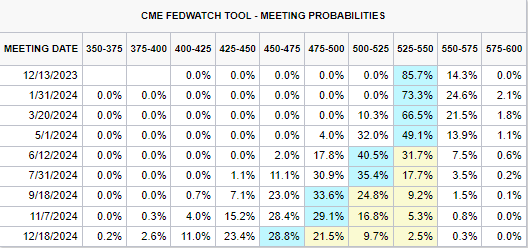
Current market pricing suggests that the Federal Reserve is done with hiking interest rates and will pivot to cutting interest at the end of H1 next year. Current pricing shows 75 basis points of cuts next year, with a strong possibility of 100 basis points in total.
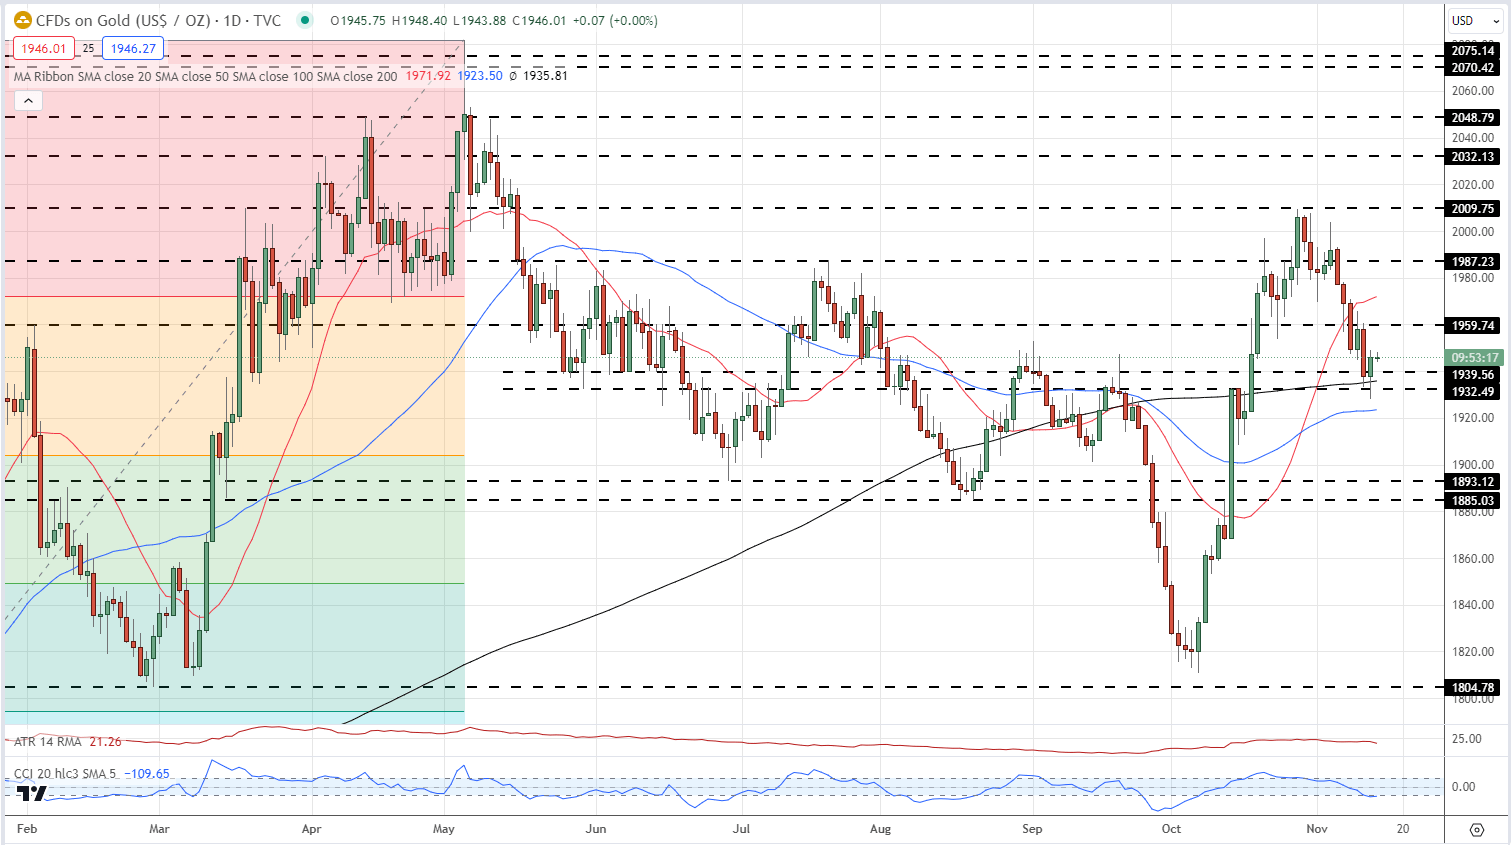
Gold continues to move lower after hitting a $2,009/oz. peak in late October. The move lower, despite the ongoing military action in the Middle East, is being driven by a general risk-on sentiment that has pushed safe haven markets lower. As long as this remains the case, gold will struggle to push higher. The technical picture is mixed with a negative series of short-term lower highs and lower lows meeting a positive reaction from the 200-day sma that is currently supporting the precious metal. The CCI indicator shows gold as oversold, but not in extreme territory. Today’s inflation report will steer gold in the coming days.
Gold Daily Price Chart – November 14, 2023
Charts via TradingView
IG Retail Trader data show 66.87% of traders are net-long with the ratio of traders long to short at 2.02 to 1.The number of traders net-long is 1.13% lower than yesterday and 22.23% higher from last week, while the number of traders net-short is 10.98% higher than yesterday and 24.37% lower from last week.
Download the latest Sentiment Report to see how daily and weekly changes affect price sentiment
| Change in | Longs | Shorts | OI |
| Daily | -14% | 12% | -2% |
| Weekly | -8% | 13% | 2% |
What is your view on Gold – bullish or bearish?? You can let us know via the form at the end of this piece or you can contact the author via Twitter @nickcawley1.


