


Gold (XAU/USD) Analysis and Charts
- Will the US Jobs Report spark another gold price shock?
- Gold’s daily chart remains positive, for now.
Most Read: XAU/USD Breaking News: Gold Reaches an All-Time High
Learn How to Trade Gold with our Complimentary Guide

A busy pre-Christmas for traders starts today with the latest US Jobs release at 13:30 UK. This week’s US labor data has been weak with Tuesday’s JOLTs Job Openings at the lowest level in nearly two-and-a-half years, while Wednesday’s private sector ADP release showed job and pay growth moderating further.
US ADP Monthly Stats
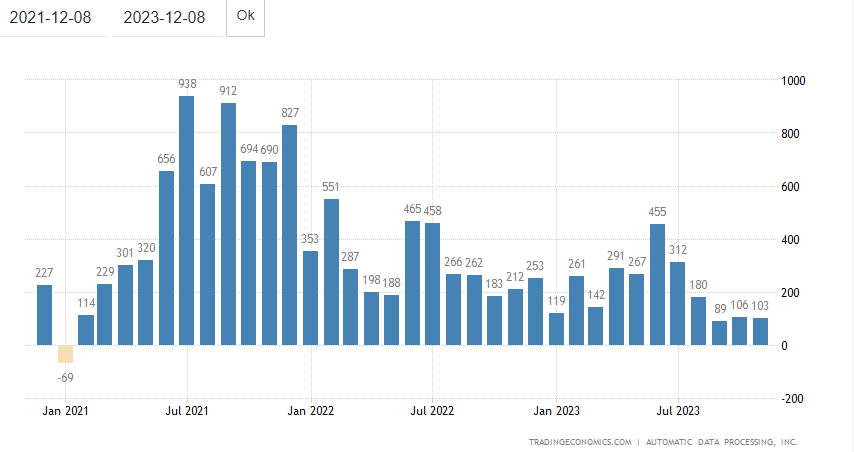

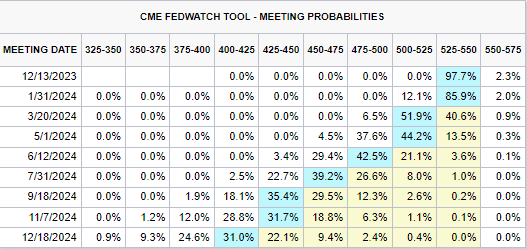
Today’s Nonfarm Payroll report is expected to show 180k new jobs created in November compared to 150k in October, while the unemployment rate is expected to remain unchanged at 3.9%. A lower-than-expected number will underpin expectations that the Fed will start cutting interest rates at the end of Q1/start of Q2 next year. The latest CME Fed Fund probabilities see a total of 125 basis points of rate cuts in the US next year.
CME Fed Fund Probabilities
The gold market started with a bang this week when the precious metal soared to a record high in Asia trade on Monday. The wider market however didn’t trust the move and sent gold back towards $2,000/oz. before XAU/USD stabilized over the last few days to its current level on either side of $2,030/oz. The technical set up remains positive with gold above all three simple moving averages, while the 50-/200-day crossover at the end of last week signaled a bullish ‘golden cross’. Initial support is seen at $2,009/oz. followed by $2,000/oz. A break above $2,032/oz. and $2,043/oz. is needed to consolidate bullish momentum.
Gold Daily Price Chart – December 8, 2023
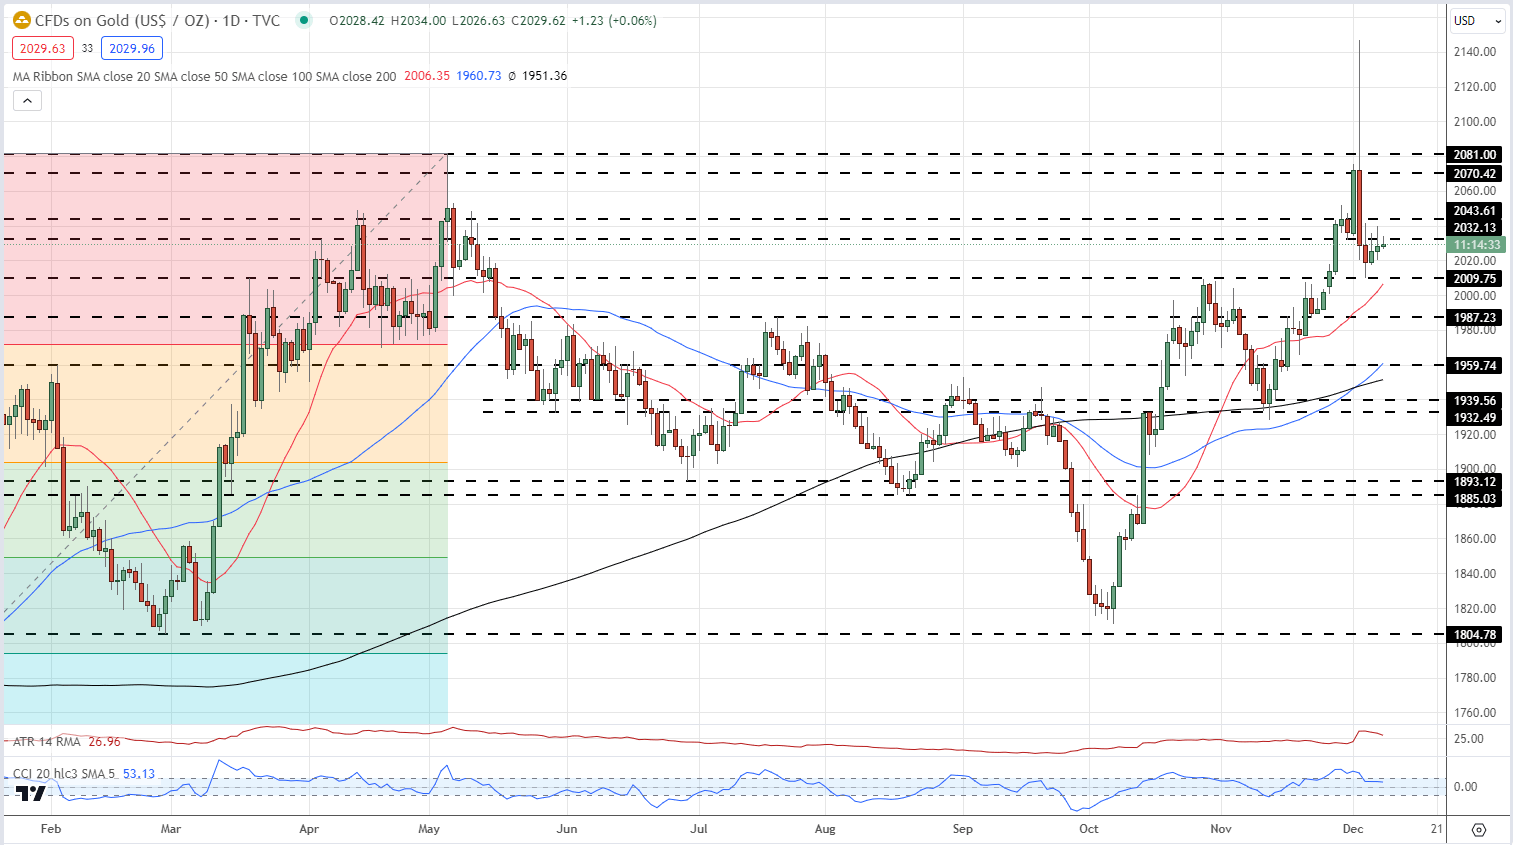
Chart via TradingView
Retail trader data shows 61.39% of traders are net-long with the ratio of traders long to short at 1.59 to 1.The number of traders net-long is 3.79% higher than yesterday and 26.55% higher than last week, while the number of traders net-short is 3.11% lower than yesterday and 26.92% lower than last week.
See how changes in IG Retail Trader data can affect price action.
| Change in | Longs | Shorts | OI |
| Daily | -6% | -5% | -6% |
| Weekly | -2% | -9% | -5% |
What is your view on Gold – bullish or bearish?? You can let us know via the form at the end of this piece or you can contact the author via Twitter @nickcawley1.


