


Gold (XAU/USD) Analysis, Prices, and Charts
- The outlook for gold remains positive
- Busy week on the economic calendar.

The escalation of military action in Gaza continues to boost the price of gold, with the precious metal hitting a fresh five month high on Friday. The ongoing safe haven bid is set to continue and a re-test of resistance around $2,009/oz. is likely in the coming days.
While the geopolitical bid is the main driver of gold’s price action, the economic calendar this week contains a handful of high importance data releases and events that could also affect the price of the precious metal. This week sees policy decisions from the Federal Reserve, the Bank of Japan, and the Bank of England, all of which are capable of springing a surprise and fueling volatility. On the economic docket, US consumer confidence, ISM manufacturing and the monthly US Jobs Report all hit the screen this week with the NFP release the most keenly watched.
Gold is likely to consolidate on either side of $2,000/oz. before testing higher levels. The chart remains positive with support seen between $1,987/oz. and $1,971/oz. (23.6% Fibonacci retracement), while the 20-day sma breaking through the 50-dsma highlights the recent strength of the precious metal. A confirmed break above $2,009/oz. should leave the $2,050/oz. level as the next level of resistance.
Gold Daily Price Chart – October 30, 2023
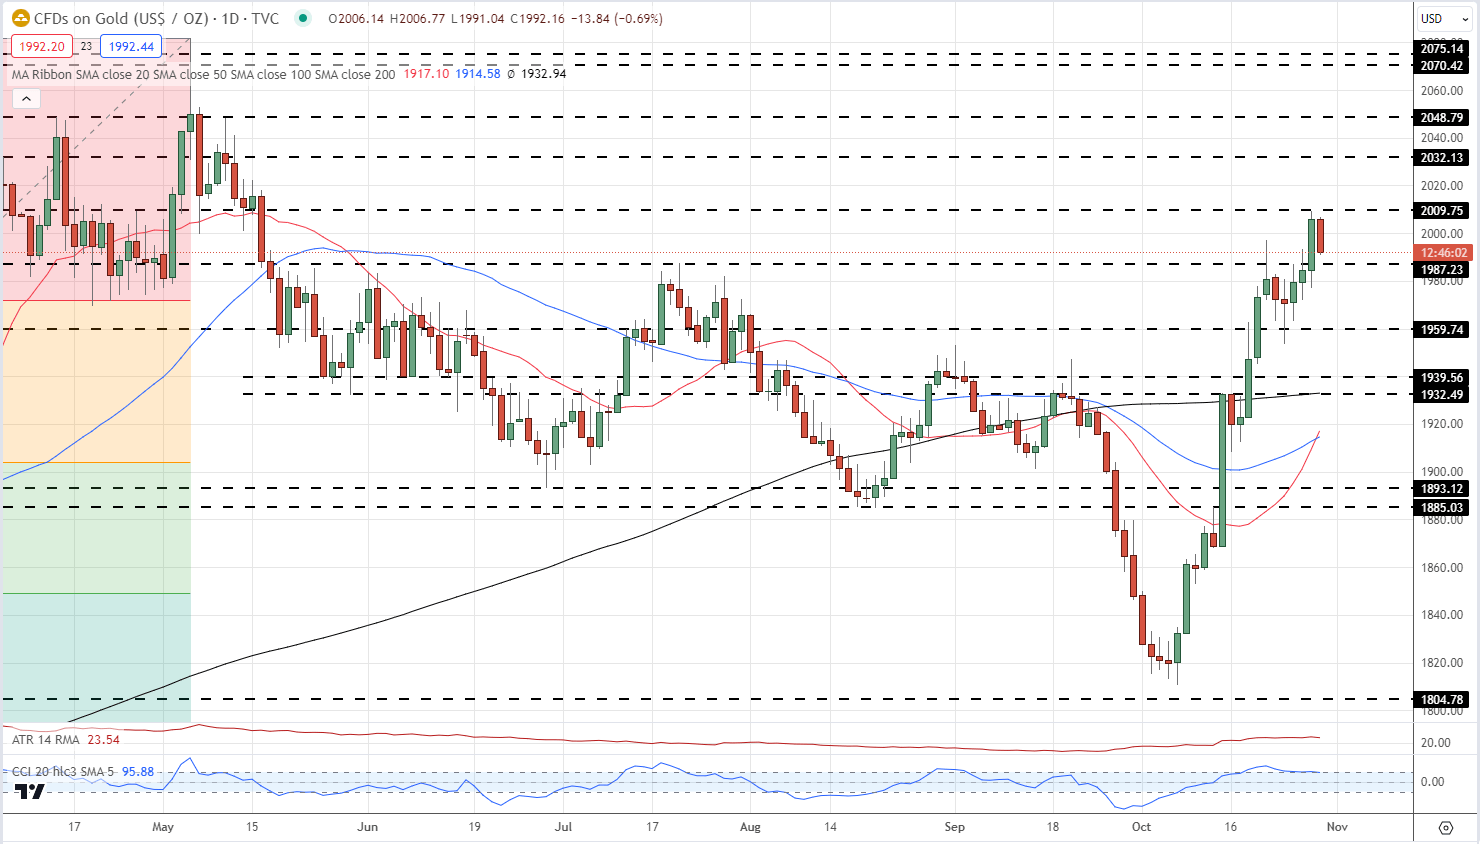
Chart via TradingView
IG Retail Trader data 57.31% of traders are net-long with the ratio of traders long to short at 1.34 to 1.The number of traders net-long is 3.36% higher than yesterday and 10.77% lower from last week, while the number of traders net-short is 7.44% higher than yesterday and 11.99% higher from last week.
Download the full Gold Sentiment Report to see how daily and weekly changes affect price sentiment
| Change in | Longs | Shorts | OI |
| Daily | -6% | -5% | -6% |
| Weekly | -2% | -9% | -5% |
What is your view on Gold – bullish or bearish?? You can let us know via the form at the end of this piece or you can contact the author via Twitter @nickcawley1.


