


XAU/USD, XAG/USD PRICE FORECAST:
- Gold (XAU/USD) Rally Gathers Steam Following Gaza Hospital Blast.
- Dollar Index (DXY) Resumes Bullish Moves as Treasury Yields Hit Multi-Year Highs but Gold Remains Unfazed.
- IG Client Sentiment Shows that Retail Traders are Overwhelmingly Long on Gold and Silver.
- To Learn More About Price Action, Chart Patterns and Moving Averages, Check out the DailyFX Education Section.
MOST READ: GBP Price Action Setups: GBP/USD, EUR/GBP, GBP/AUD Post UK CPI
Gold extended its gains throughout the day today in light of increased risk aversion from market participants. The rise of the risk-off environment today comes courtesy of an explosion of a hospital in Gaza last night which saw both Israel and Palestine trade blame for the atrocity. The impact and fallout spurred renewed concern of a wider conflict which helped Gold accelerate toward the $1950/oz handle.
Supercharge your trading prowess with an in-depth analysis of gold's outlook, offering insights from both fundamental and technical viewpoints. Claim your free Q4 trading guide now!

FED POLICYMAKERS, MIDDLE EAST TENSIONS AND US TREASURIES
The US has seen another week of upbeat data as retail sales smashed estimates. The result has seen a slight uptick in rate hike projections for the Fed at the December meeting. Meanwhile Fed policymakers have been out in force this week with many not ruling out additional hikes but rather reiterating the importance of the data ahead. Federal Reserve policymaker Waller stated today that a slowdown in the real economy could see the Fed hold rates steady. If there is one thing many analysts seem to agree on is that higher for longer narrative continues to grow from strength to strength.
Another positive according to the Fed is the longer dated US treasuries which continue to advance. The US 10Y yield has hit multi-year highs this week and printed a fresh 2023 high with Fed policymakers believing a higher yield on longer dated treasuries could do some of the heavy lifting for them. As you can see on the chart below the US 10Y is now trading at levels last seen in in January of 2007.
US Treasury Yield 2Y & 10Y, Four-Hour Chart
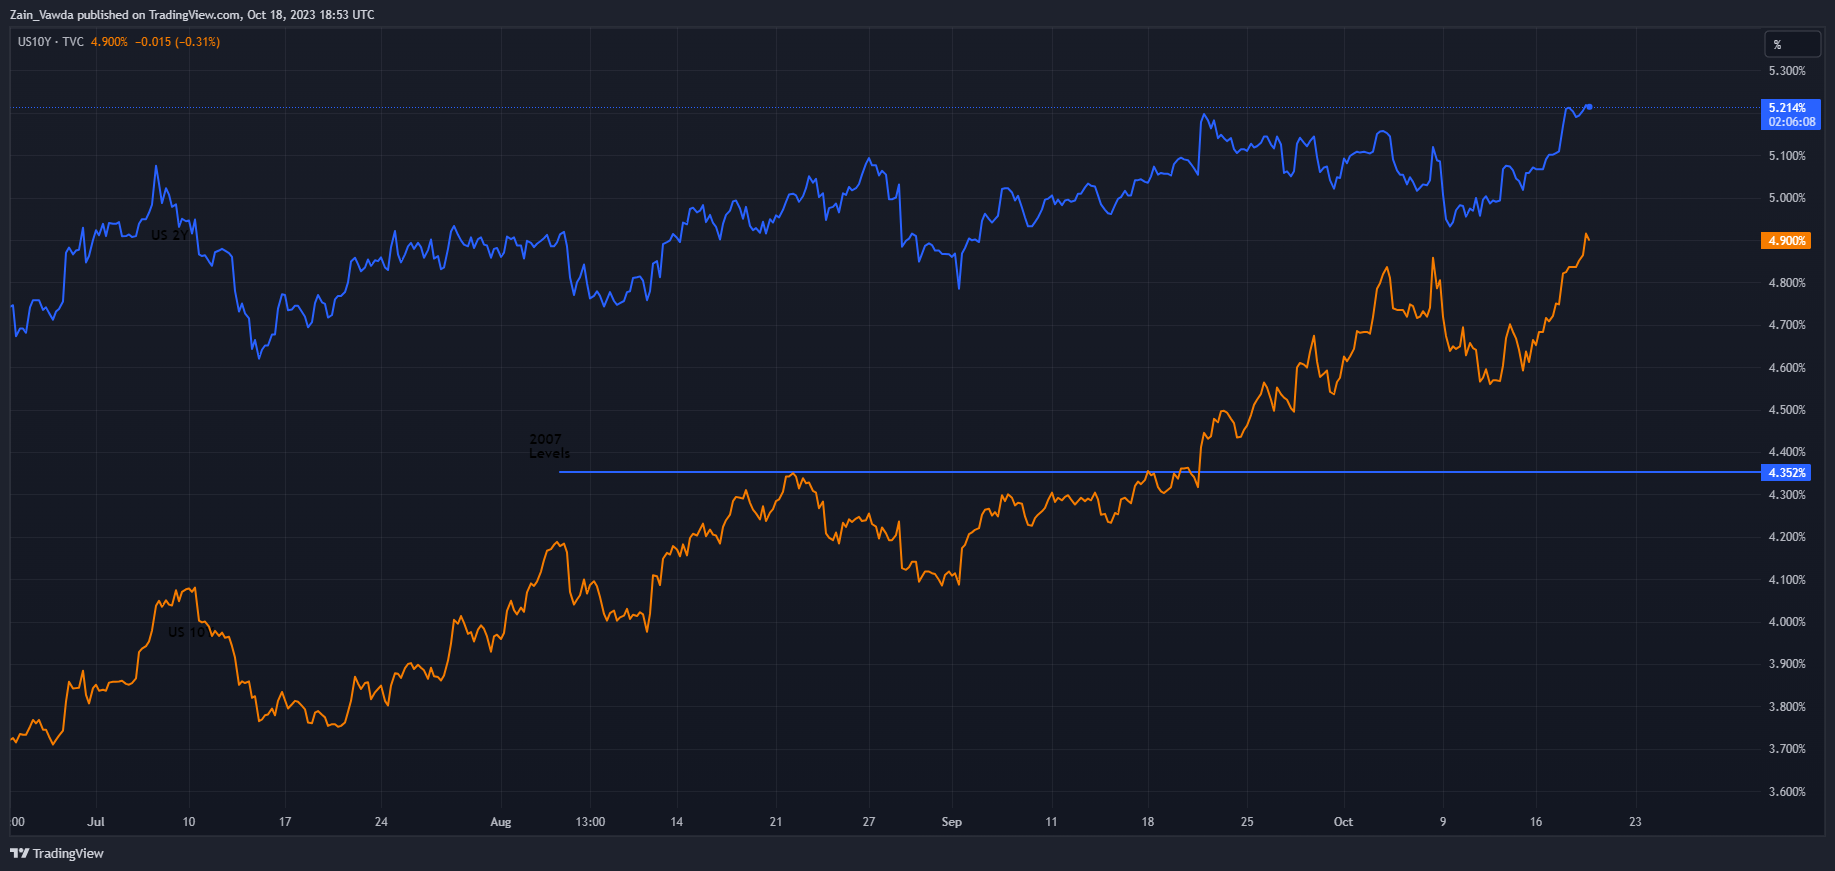
Source: TradingView, Created by Zain Vawda
Looking at the Middle East situation and I have said this repeatedly over the past week regarding escalation. As things stand Iran has been the most vocal country in the region which isn’t a surprise given the strained relations with Israel. I do not expect any country in particular to get involved directly, however if one understands the Middle East then escalation via proxies remains extremely plausible at this stage. The likes of Hezbollah and potentially other smaller terror groups in the region could very well join with funding or weapons from countries in the region.
Any development that threatens to bring the US more to the forefront of the conflict could see Gold prices accelerate once more. The $2000 level will remain under threat the longer the conflict drags on without a ceasefire or resolution and should be monitored in the days ahead.
If you're puzzled by trading losses, why not take a step in the right direction? Download our guide, "Traits of Successful Traders," and gain valuable insights to steer clear of common pitfalls that can lead to costly errors.

RISK EVENTS AHEAD
The majority of the major risk ahead in terms of Gold is likely to come from the Middle East for the remainder of the week. There is no high impact data releases which are likely to impact Gold and Silver prices for the rest of the week. This is evidenced by the rise in the Dollar today which had very little impact on Gold and Silver as the rally in both commodities actually gathered steam today.
For all market-moving economic releases and events, see the DailyFX Calendar
TECHNICAL OUTLOOK
GOLD
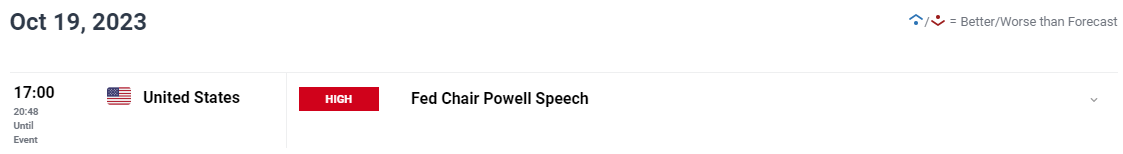
Form a technical perspective, Gold has broken the descending trendline that had been in play since mid-July. The upside rally has been expansive with very little pullback with a high today of around $1962/oz at the time of writing.
A daily close above the $1950 mark will likely be required for bullish continuation. Under normal circumstances this would be key but given the geopolitical situation, a close below $1950 could still see bullish continuation tomorrow depending on risk sentiment heading into the weekend. $1950 has been a key area of resistance on two occasions since August, underlining the importance of the level.
Although the RSI is not always the most accurate indicator particularly around high impact data event or external drivers, the 14-day RSI is approaching overbought territory and could come into play tomorrow should the rally continue.
Key Levels to Keep an Eye On:
Resistance levels:
- 1962
- 1980
- 2000
Support levels:
- 1940
- 1929
- 1912
Gold (XAU/USD) Daily Chart – September 21, 2023
Source: TradingView, Chart Prepared by Zain Vawda
XAG/USD
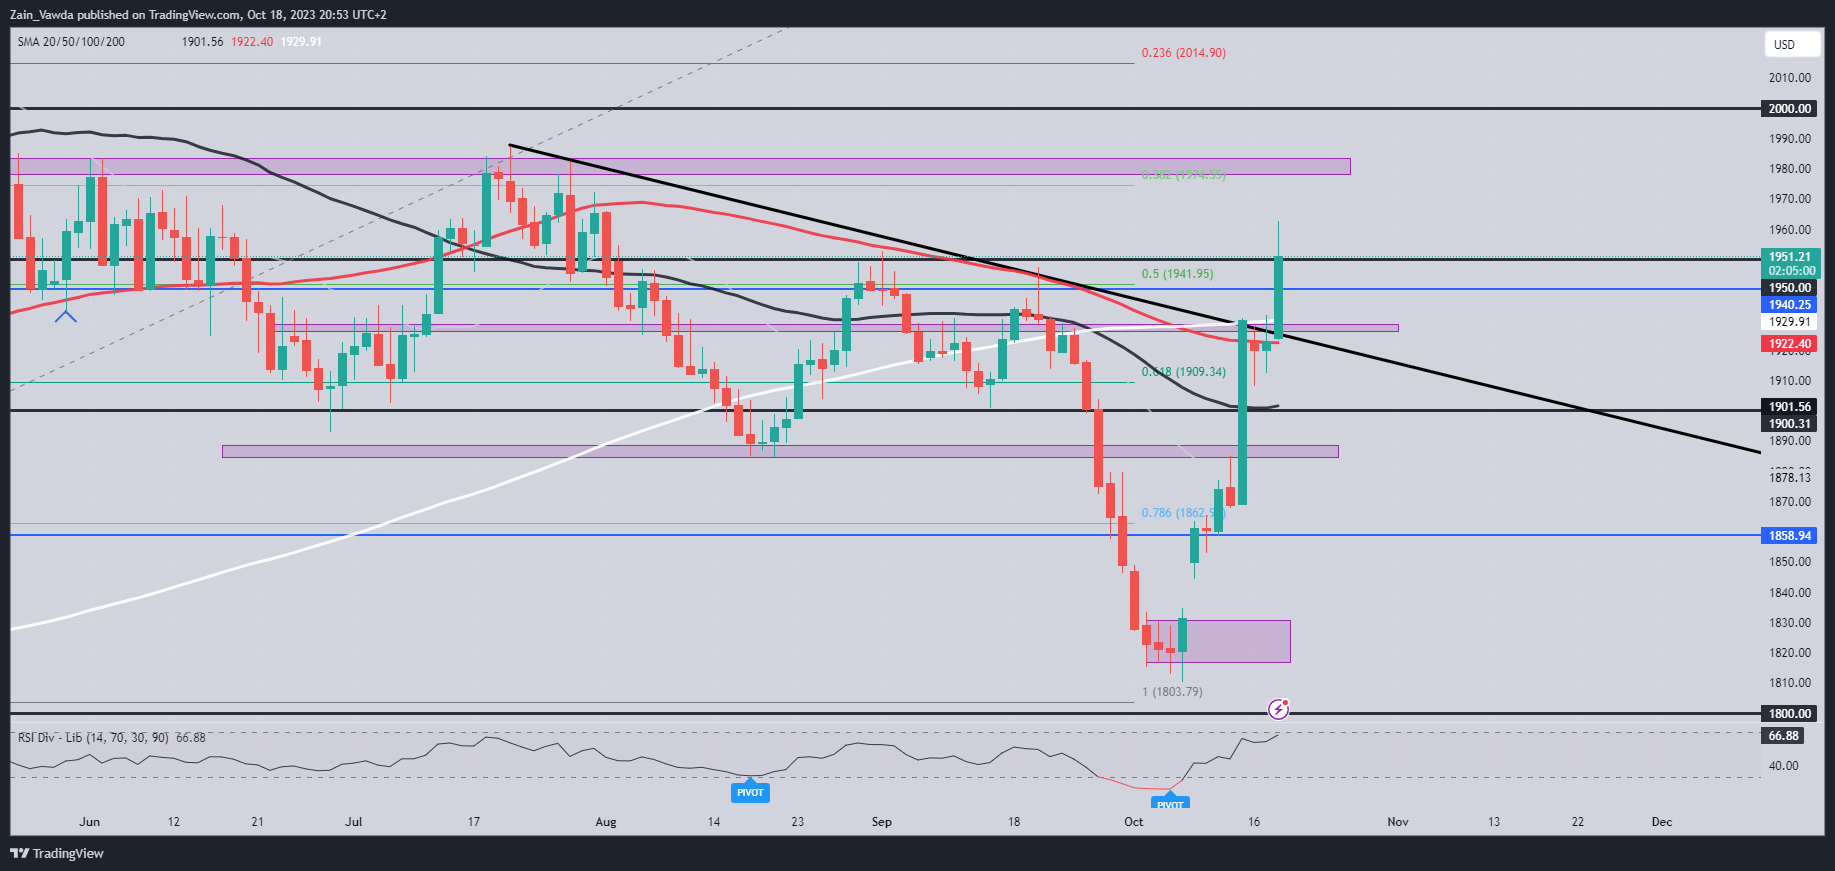
Silver prices appeared to be in freefall having broken below the long-term symmetrical triangle pattern at the end of September. Much like Gold the commodity appears to have benefitted from the Middle East tension despite a strong US Dollar. Silver has however run into a key confluence area around the 23.23 mark where we have a key resistance level coupled with both the 100 and 200-day MAs.
Having had a ullback from the confluence area, Silver is now trading below the 50-day MA with a close below leaving the commodity vulnerable to a deeper pullback. Unlike Gold who is likely to benefit from safe-haven appeal, Silver has historically not enjoyed the same priviledge. This begs the question of whether a stronger US Dollar should tensions intensify in the Middle East push Silver lower or not?
Silver (XAG/USD) Daily Chart – September 21, 2023
Source: TradingView, Chart Prepared by Zain Vawda
IG CLIENT SENTIMENT
Taking a quick look at the IG Client Sentiment, Retail Traders are Overwhelmingly Long on Silver with 88% of retail traders holding Long positions. Given the Contrarian View to Crowd Sentiment Adopted Here at DailyFX, is this a sign that the Silver rally may have run its course, and a retracement is imminent?
For a more in-depth look at Client Sentiment as well as Tips and Tricks on how to incorporate it in your trading, Download the Guide Below!!
| Change in | Longs | Shorts | OI |
| Daily | 1% | 12% | 4% |
| Weekly | -9% | 45% | 3% |
Written by: Zain Vawda, Markets Writer for DailyFX.com
Contact and follow Zain on Twitter: @zvawda


