


Gold Price (XAU/USD), Chart, and Analysis
- US Treasury yields move higher but resistance is near.
- The FOMC rate decision will set the stage for gold.

The US dollar is picking up a small bid ahead of the eagerly awaited FOMC rate decision tomorrow, aided by a move higher in US Treasury yields. A 25 basis point rate hike is expected, and already priced into the market, but the post-decision press conference is where the real detail of the Fed’s intentions will be seen. Chair Powell is expected to underline that US interest rates will continue to move higher, and stay there for longer, adding a hawkish tilt to the meeting. However, as discussed before, the market is disregarding the Fed’s narrative and is pricing in a 25 basis point hike in March, a period of consolidation, before rate cuts are mooted in Q4 this year. How hard Powell pushes back against the market will decide the path for the US dollar, and a range of risk markets, in the weeks ahead.
For all market-moving events and data releases, see the real-time DailyFX Calendar
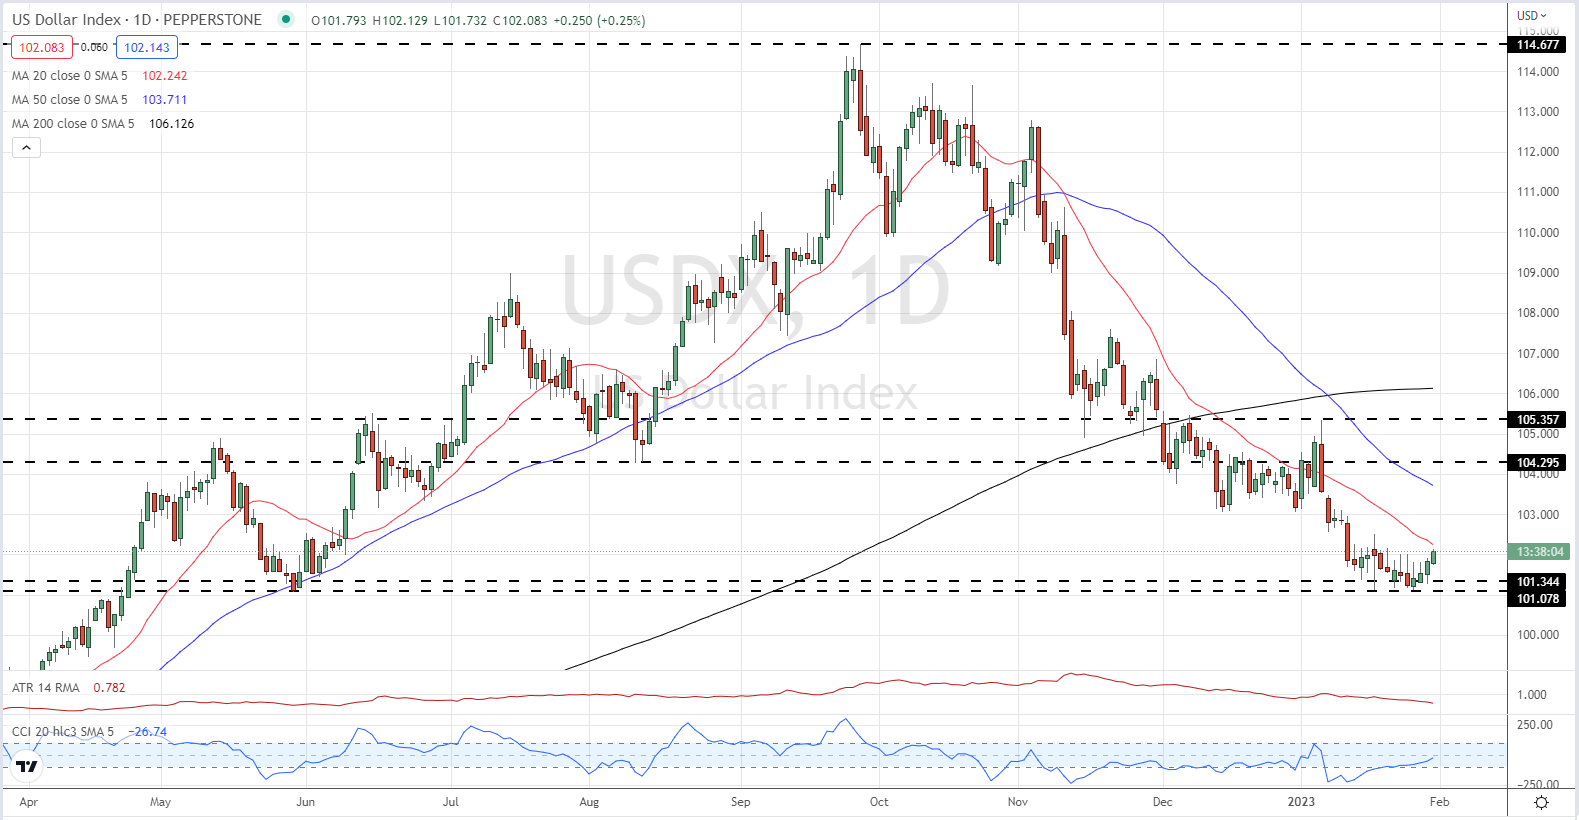
The US dollar index is pushing higher today as the Fed decision nears. The DXY is also benefitting from a slightly weaker Euro today, while Sterling is also on the backfoot after the IMF warned that the UK economy would likely shrink this year.
US Dollar Index (DXY) – Daily Chart - January 31, 2023.
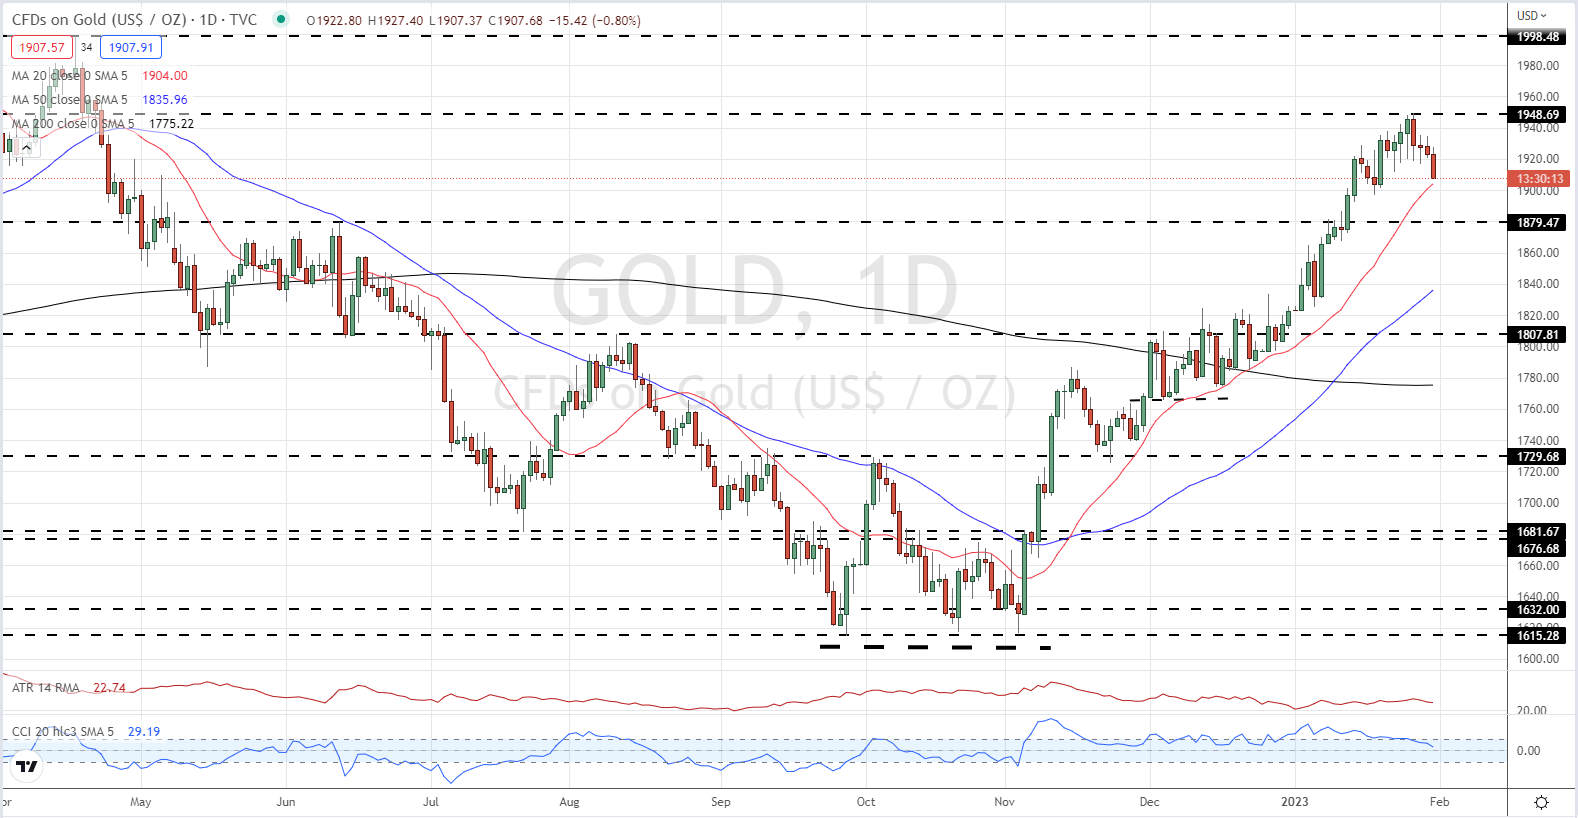
Gold is slipping through recent support levels and may test $1,900/oz. pre-FOMC. While a current pattern of four red candles highlights the precious metal’s current weakness, it should be remembered that gold has been a one-way bet since early November when it changed hands around $1,615/oz. All three moving averages remain supportive.
Gold Price Chart – Daily Chart - January 31, 2023
Charts via TradingView
| Change in | Longs | Shorts | OI |
| Daily | 1% | 1% | 1% |
| Weekly | -2% | -9% | -5% |
Retail Traders Increase Longs and Shorts
Retail trader data show 55.32% of traders are net-long with the ratio of traders long to short at 1.24 to 1.The number of traders net-long is 4.18% higher than yesterday and 9.42% higher from last week, while the number of traders net-short is 9.31% higher than yesterday and 7.55% higher from last week.
We typically take a contrarian view to crowd sentiment, and the fact traders are net-long suggests Gold prices may continue to fall. Positioning is less net-long than yesterday but more net-long from last week. The combination of current sentiment and recent changes gives us a further mixed Gold trading bias.
What is your view on Gold – bullish or bearish?? You can let us know via the form at the end of this piece or you can contact the author via Twitter @nickcawley1.


