Gold (XAU/USD) Analysis
- Bullish impetus reflects the positive outlook for gold into 2024
- Gold volatility spikes but follow-through remains uncertain
- The analysis in this article makes use of chart patterns and key support and resistance levels. For more information visit our comprehensive education library

Bullish Impetus Reflects the Positive Outlook for Gold in 2024
The gold market attempted to catch its breath after a phenomenal day of trading yesterday. Registering a 5.42% round trip, the price of gold obliterated the prior swing all-time-high around $2081 only to retrace the move and end the day significantly lower.
The RSI surged into overbought territory and has already recovered – highlighting the massive amount of volatility experienced yesterday. Today, however, trading has been more moderate, trading below the $2050 level but the uptrend remains well intact and well above the 200-day simple moving average (SMA).
Gold bulls appear to be in the driving seat after US yields topped and markets continue to price in interest rate cuts in 2024. Lower interest rates typically deflate the value of the dollar which provides a relative discount for foreign (non-US domiciled) purchases of the dollar-based commodity.
The safe-haven appeal also remains as Israel continued its aggression on Hamas targets after the ceasefire had come to an end. Support resides at $2010 with immediate resistance at $2050, followed by $2081.80.
Gold Daily Chart
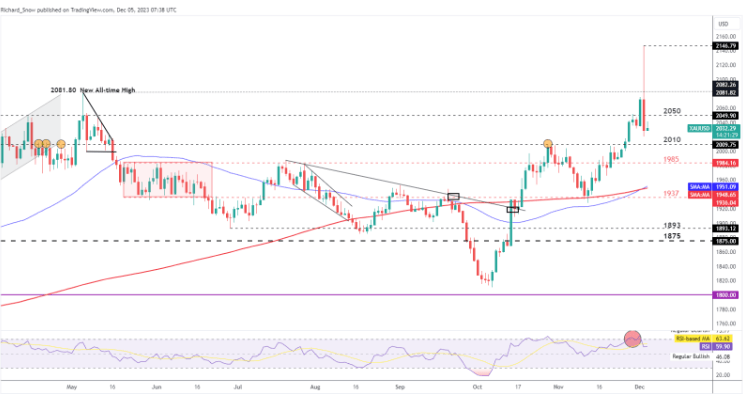

Source: TradingView, prepared by Richard Snow
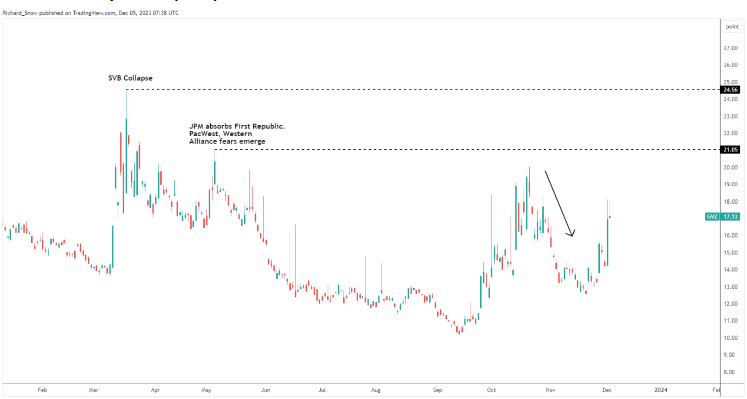
The chart below pertains to expected 30-day gold volatility and shows just how much of a move we saw yesterday, sending the GVZ index massively higher. In the lead-up to yesterday, gold volatility has subsided as the initial impact of the Israel-Hamas war dragged on.
Gold Volatility Index (GVZ)