


Gold (XAU/USD) Analysis
- Gold’s bullish momentum weighed down by general lift in sentiment
- Gold prices test key level of support as the current pullback extends
- The analysis in this article makes use of chart patterns and key support and resistance levels. For more information visit our comprehensive education library
Gold’s Bullish Momentum Weighed Down by General Lift in Sentiment
The FOMC statement and presser resulted in a reduced expectation that the Fed will hike rates in December – the final meeting for the year. Jerome Powell attempted to keep the door open for another rate hike after expressing that the majority of the committee foresee a greater probability of another rate hike before rate cuts appear on the horizon. Outperformance in US data poses upside risks to inflation, something the Fed has used to avoid any notion that interest rates are at their peak. This is because the Fed understands that once markets know we’re at a peak, they will start to price in rate cut, loosening financial conditions.
Fed funds futures suggest that the market now places the likelihood of another rate hike in December at 20%, down from a month earlier at 40%. The Fed’s hawkish message with dovish undertones has resulted in a continuation of the risk on sentiment with global sock indices posting impressive rises. Stocks are up, bonds are up (yields down) and the dollar lower – with gold failing to rise.
The weekly chart shows gold is on track for its first weekly decline since the Middle East conflict began. The market is due a pullback given the exponential rise that started on the 9th of October. $1956 is the nearest level of support on the weekly chart.
Gold (XAU/USD) Weekly Chart
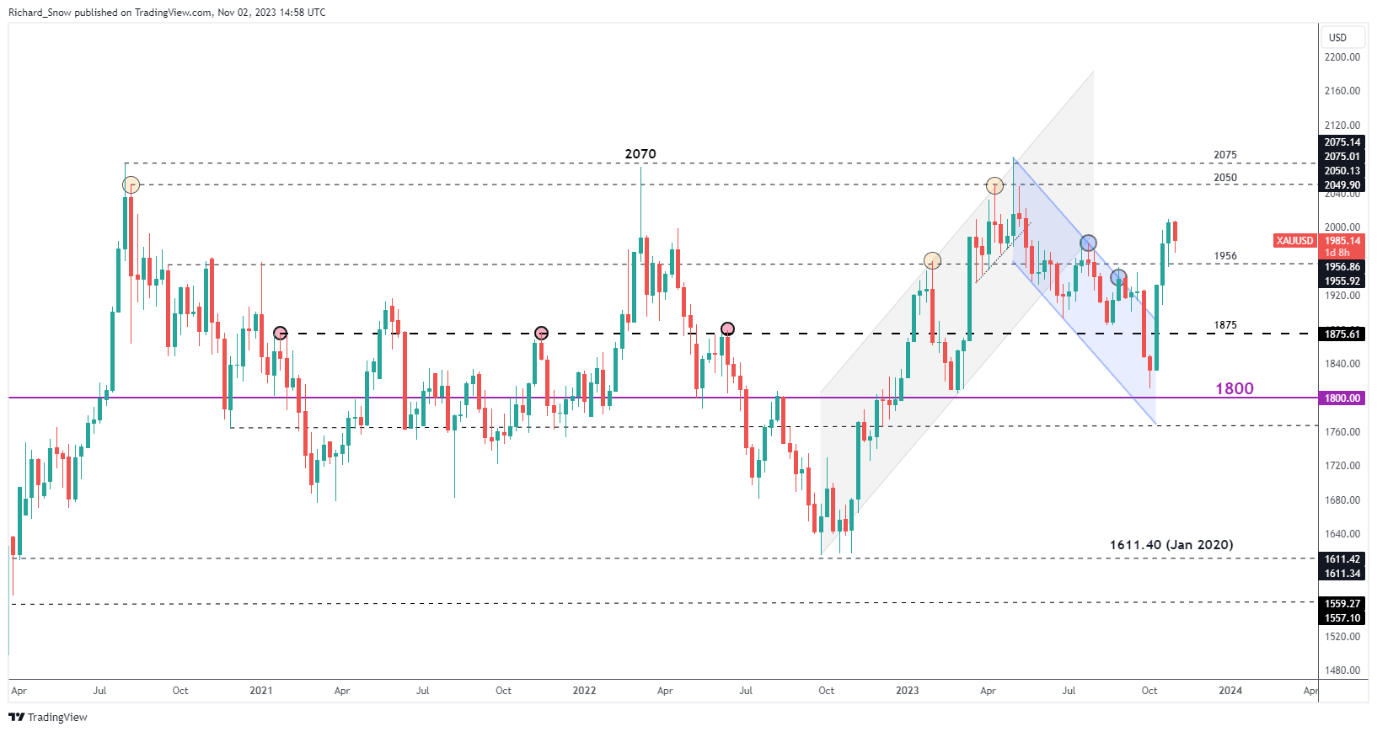
Source: TradingView, prepared by Richard Snow
Supplement your trading knowledge with an in-depth analysis of gold's outlook, offering insights from both fundamental and technical viewpoints. Claim your free Q4 trading guide now:

As the war has gone on, the gold volatility index has been steadily declining. While failing to reach similar levels as prior spikes, the trough to peak matches that of the banking turmoil in March this year. Expected volatility has waned as gold prices slowed.
30-Day Expected Gold Volatility (GVZ)
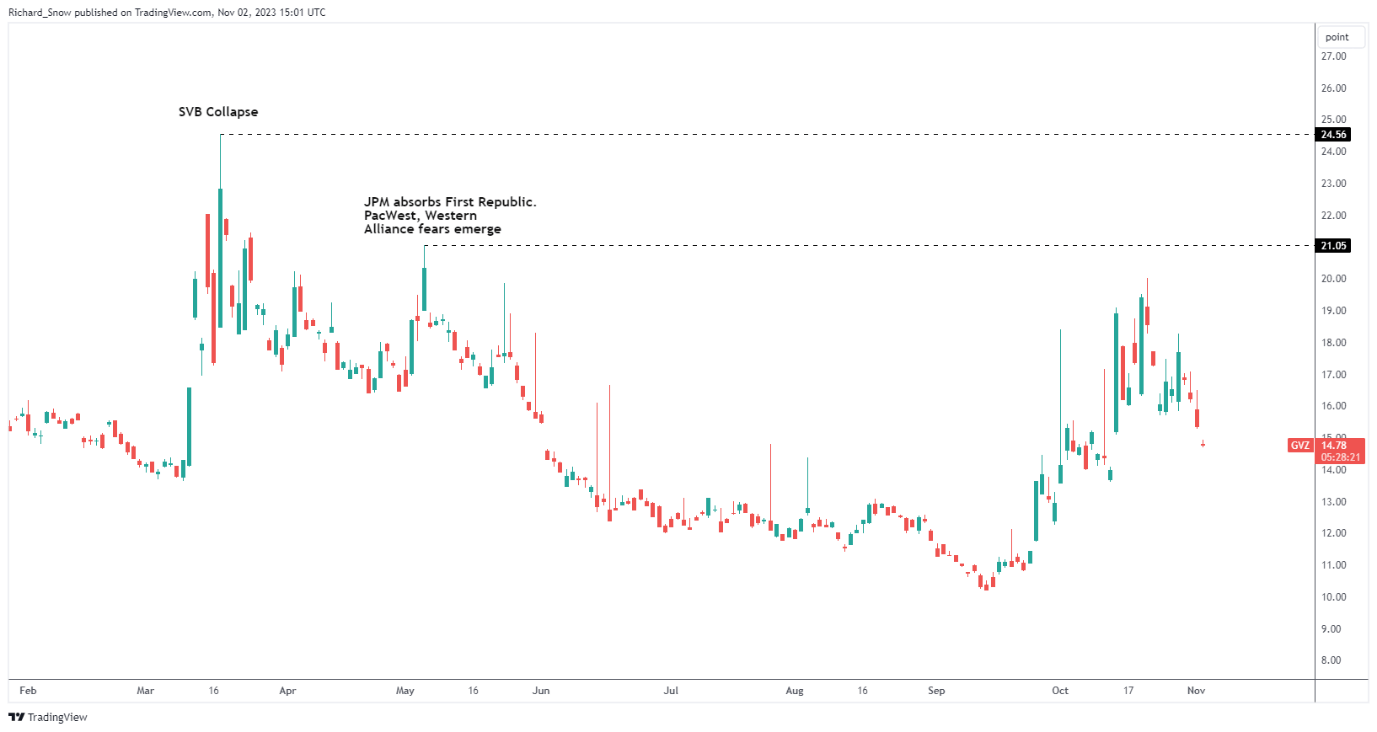
Source: TradingView, prepared by Richard Snow
The daily chart shows how gold touched the $2010 level before turning lower. $1985 is the immediate level of support that is currently being tested. A weekly close below $1985 highlights the 200 SMA which appears at $1937.
Gold (XAU/USD) Daily Chart
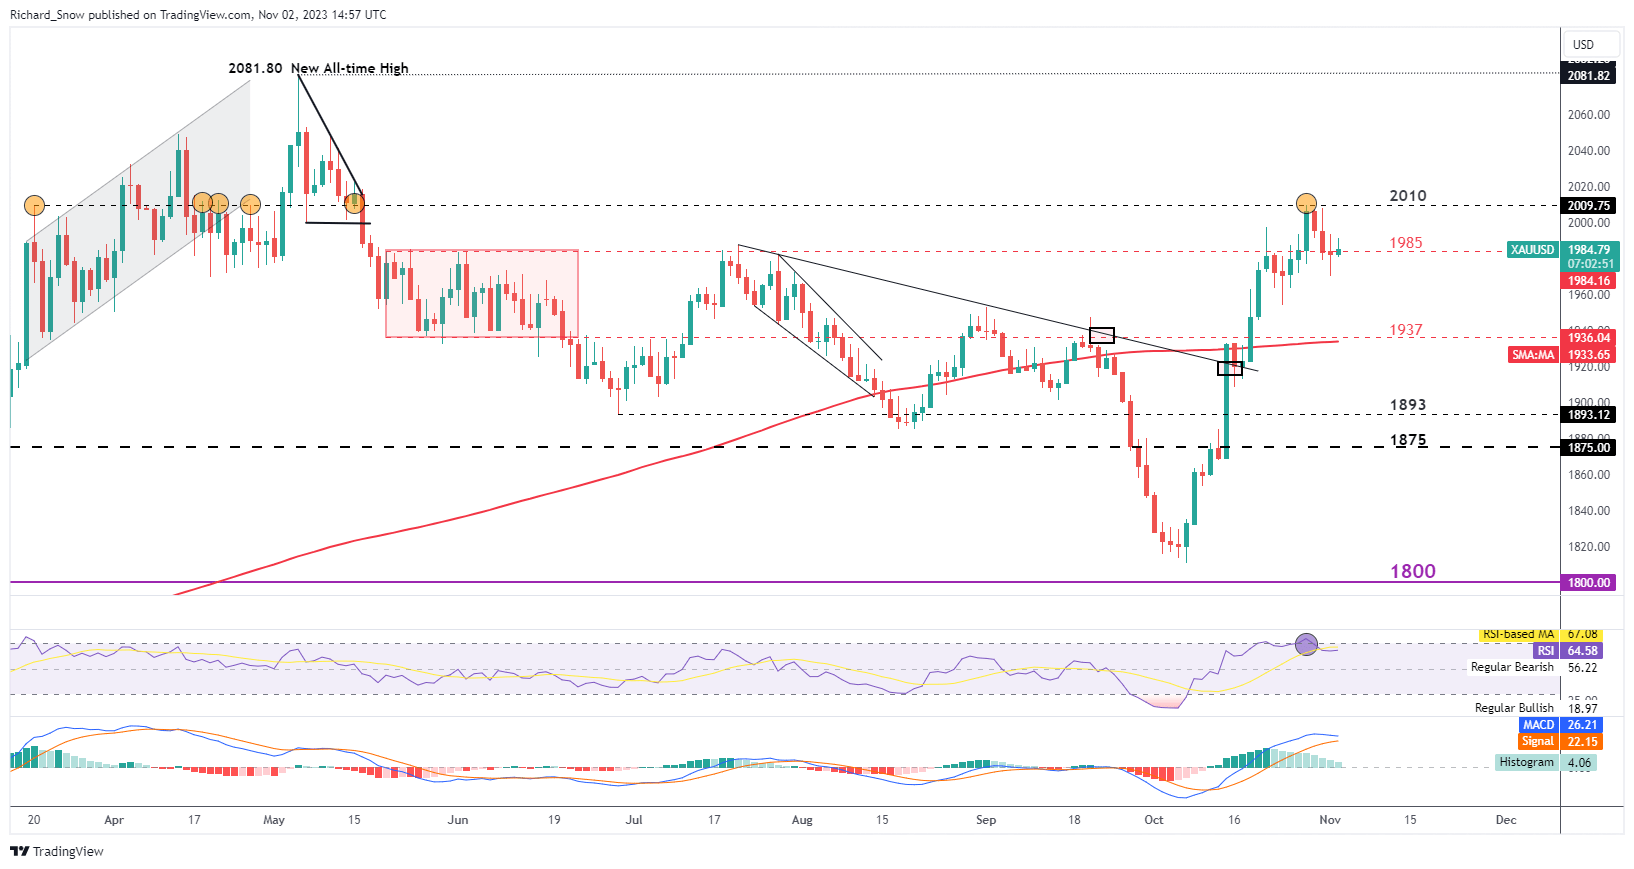
Source: TradingView, prepared by Richard Snow

--- Written by Richard Snow for DailyFX.com
Contact and follow Richard on Twitter: @RichardSnowFX


