


Gold, XAU/USD, FOMC, Fed, Treasury Yields, US Dollar, Real Yield, China - Talking Points
- The gold price has been somewhat listless of late but that might change on US CPI
- Treasury yields have steadied going into a crucial couple of days with the Fed in focus
- If inflation beats forecasts, will real yields exert themselves on the XAU/USD price?

The gold price edged up to start Tuesday’s session as the market contemplates the possible outcomes of US CPI and PPI ahead of the Fed’s Federal Open Market Committee (FOMC) meeting late Wednesday.
Treasury yields have been remarkably steady so far this week ahead of the crucial inflation data and monetary policy meeting. The 2s 10s curve inversion remains deeply negative below -0.80% but equity markets don’t seem too fazed by what the bond market is saying.
At the same time that nominal yields have plateaued out, the US 10-year real yield continues to tick slightly north, trading above 1.5%.
The real yield is the nominal yield less the market-priced inflation rate derived from Treasury inflation-protected securities (TIPS) for the same tenor.
If CPI data later today is notably different to expectations, the real yield might see volatility that could see the gold price react accordingly. When the 10-year real yield was at these levels in February, the yellow metal was below US$ 1,850.
A Bloomberg survey of economists is forecasting CPI to be 0.1% month-on-month for May against 0.4% prior. Further details of the data can be found on the DailyFX calendar here.
The US Dollar is a bit softer so far on Tuesday and has helped crude oil lift itself off a 5-week low. The WTI futures contract is near US$ 67.50 bbl while the Brent contract is a touch above US$ 72 bbl.
The People’s Bank of China (PBOC) gave markets a slight boost when they cut the 7-day reverse repo rate from 2% to 1.9%.
APAC equities are mostly slightly in the green after a positive lead from the Wall Street close. Futures are pointing to a steady start to its cash session.
For all today’s data releases, see the calendar here.

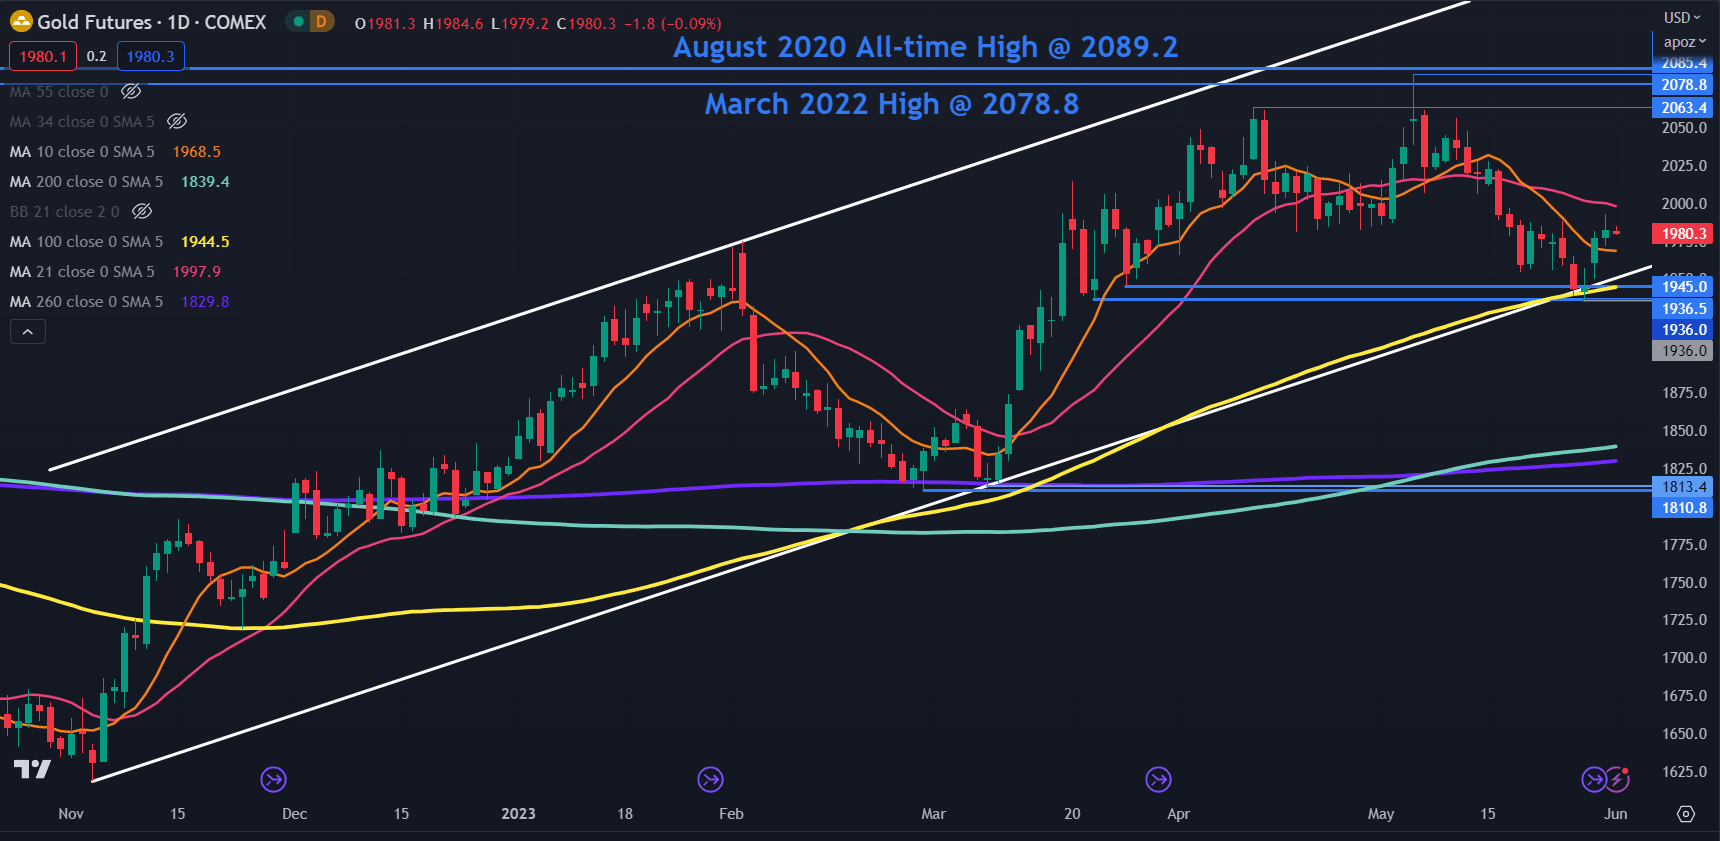
GC1 (GOLD FRONT FUTURES CONTRACT) TECHNICAL ANALYSIS
Gold remains in an ascending trend channel that began in November last year and it continues to toy with the idea of breaking the lower ascending trend line of that channel.
A clean break below this trend line might suggest that the bullish run could face scrutiny
The 100-day Simple Moving Average (SMA) is below the ascending trend line ahead of the prior lows in the 1936 – 1945 area that may provide a support zone
If these support levels are broken, a bearish run may evolve, and the next support zone of note could be at the Double Bottom of 1811 and 1813.
If the nearby support levels hold and the price moves back above the short-term 10- and 21-day SMAs, it might suggest that bullish momentum could unfold further.
The early May high of 2085 eclipsed the March 2022 peak of 2079 but was unable to overcome the all-time high of 2089. This failure to break new ground to the upside has created a Triple Top which is an extension of a Double Top formation.
This has set up a potential resistance zone in the 20280 – 2090 area but a snap above those levels may indicate evolving bullishness. The next level of resistance could be at the upper ascending trend channel line that is currently near 2185.
--- Written by Daniel McCarthy, Strategist for DailyFX.com
Please contact Daniel via @DanMcCathyFX on Twitter


