


GBP/USD Analysis and Charts
- Dovish BoE chatter sending UK bond yields sharply lower.
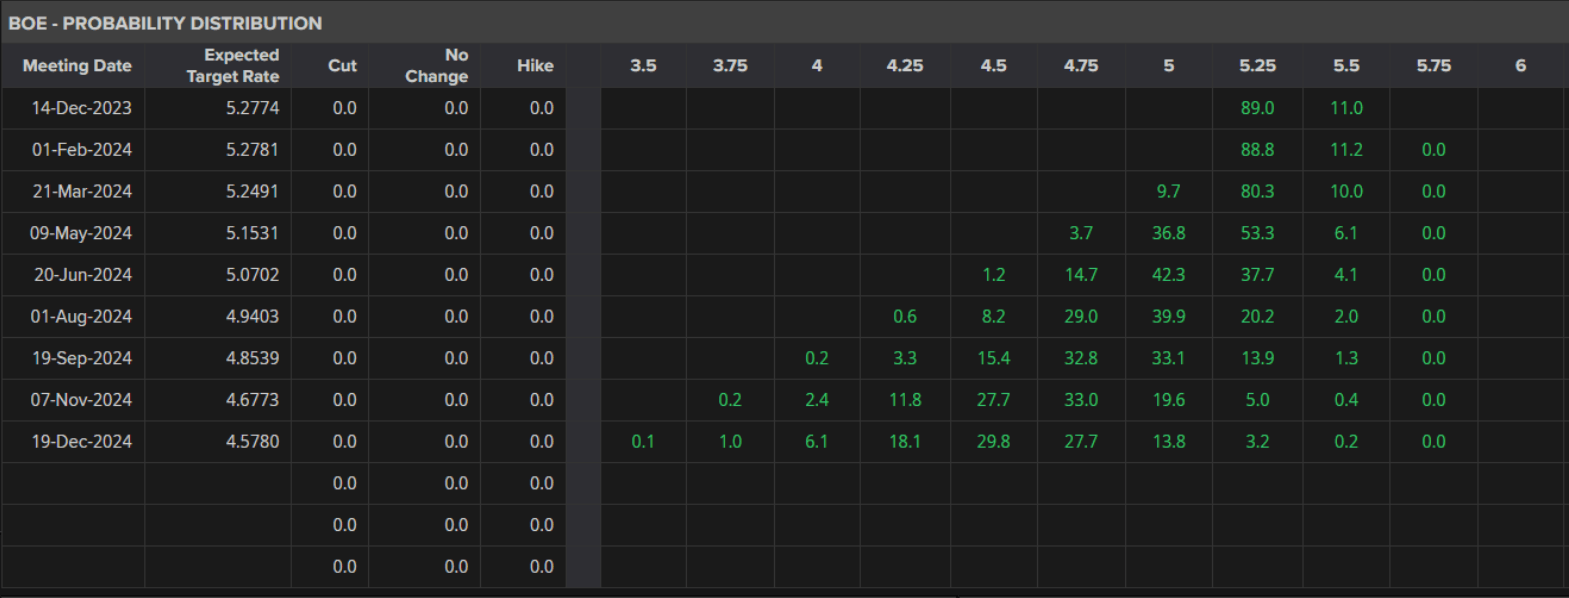
- Three 25 basis point rate cuts next year are now being priced in.
The BoE’s chief economist Huw Pill said last night that UK inflation is likely to fall sharply in the coming months and that current market pricing of interest rate cuts next year are not ‘unreasonable.’ The market has taken Mr. Pill’s words to heart and is now pricing in three quarter-point rate cuts next year.

For all market-moving economic data and events, see the DailyFX Calendar
The Bank of England last week left the UK Bank Rate unchanged as it continues to struggle with above-target inflation and a weak economy. The latest S&P Global CIPS Services data showed the UK economy declining for the third month in a row, and this Friday’s GDP release is expected to show the UK economy flatlining and heading for a technical recession.
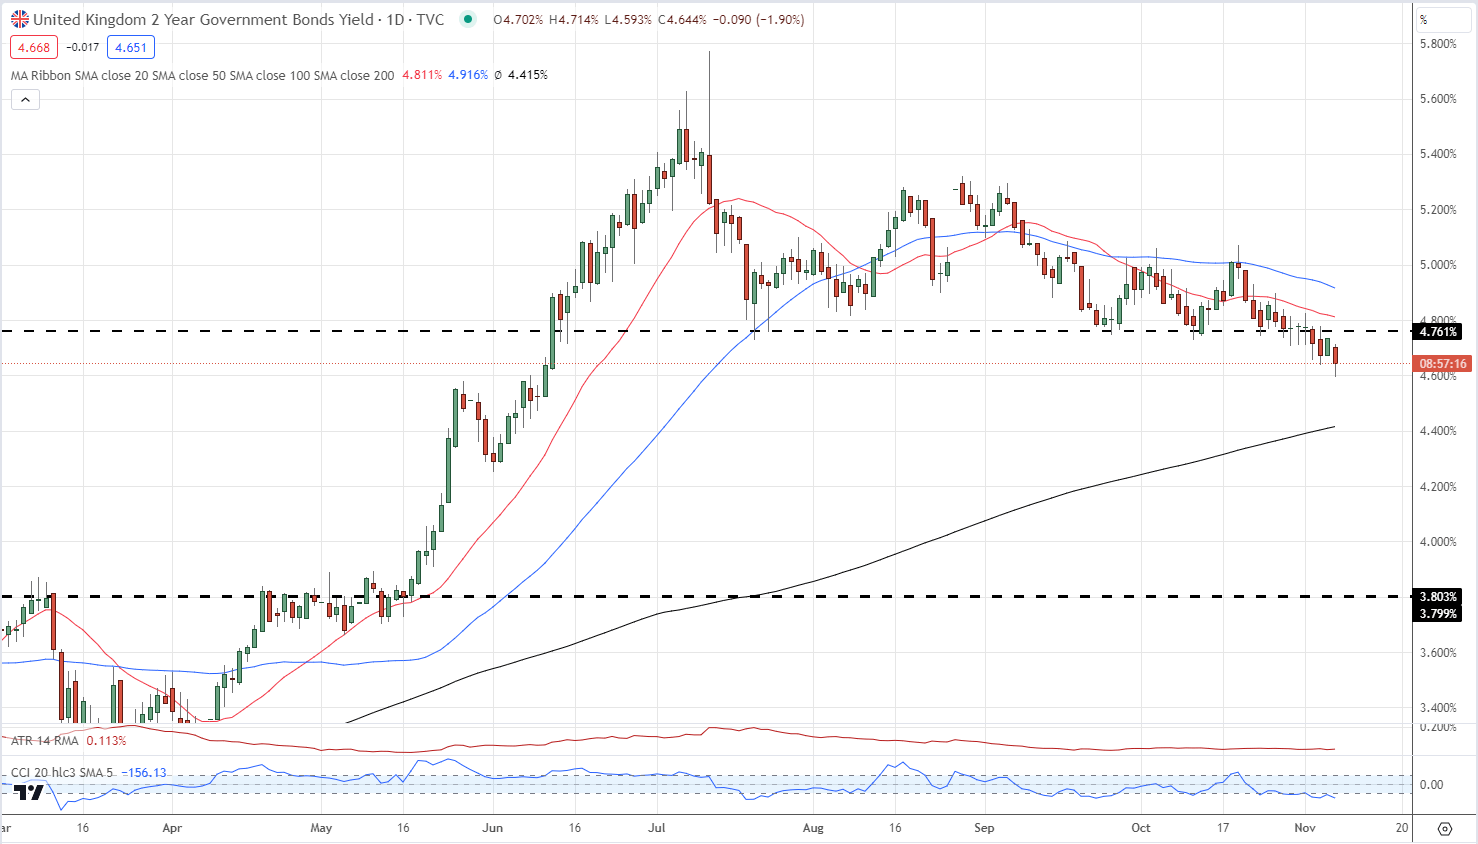
The yield on the interest rate-sensitive UK 2-year Gilt fell to a fresh five-month low this morning, before trimming some of its losses, while the yield on the 10-year benchmark is edging towards to a new multi-week low. UK 2-year government bond yields spiked to a 5.77% high on July 12th.
UK 2-Year Gilt Yields Daily Chart
Learn How to Trade GBP/USD with our Free Guide

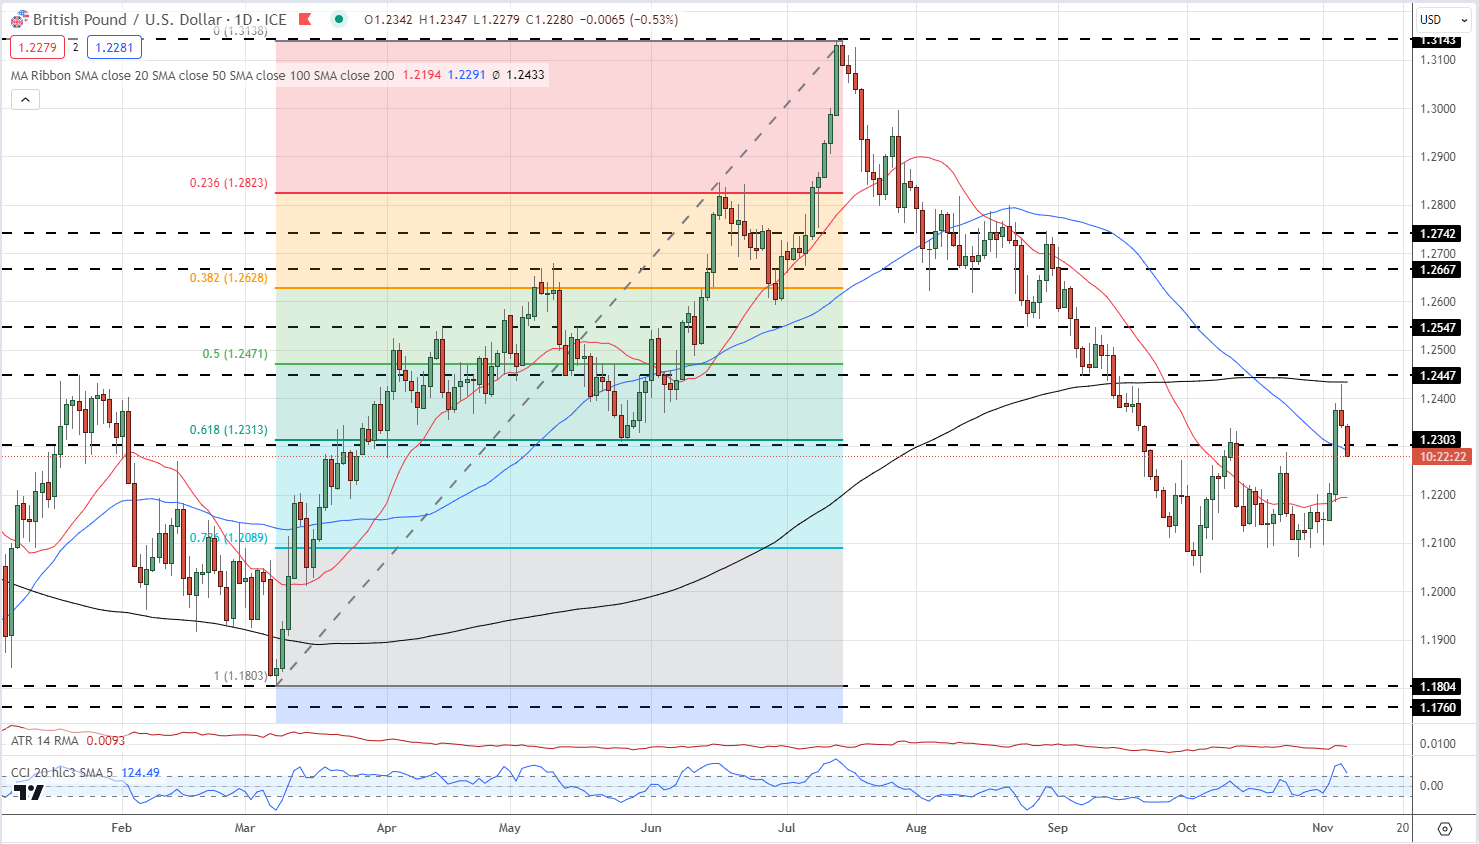
The recent GBP/USD rally has turned with the pair now back below 1.2300 after having touched a 1.2428 high on Monday. The US dollar is also weakening as traders begin to price in a series of rate cuts in the US next year. From a technical perspective, the 200-day sma acted as resistance at the start of the week ahead of horizontal resistance at 1.2447 and 50% Fibonacci retracement at 1.2471. The next level of support is seen around 1.2200.
GBP/USD Daily Price Chart
Charts using TradingView
How GBP/USD Traders are Currently Positioned and What it Means for Price Action
| Change in | Longs | Shorts | OI |
| Daily | -5% | -15% | -10% |
| Weekly | -10% | 3% | -5% |
What is your view on the British Pound – bullish or bearish?? You can let us know via the form at the end of this piece or you can contact the author via Twitter @nickcawley1.


