Article written by Axel Rudolph, Senior Market Analyst at IG
GBP/USD remains under pressure in six-month lows
Following last week’s decision by the Bank of England’s (BOE) to keep rates steady at 5.25%, the British pound remains under pressure and continues to trade in six-month lows versus the greenback.
A fall through last week’s $1.2235 low would eye the mid-March high and 24 March low at $1.2204 to $1.2191.
Minor resistance continues to be seen at the $1.2309 May low and significantly further up along the 200-day simple moving average (SMA) at $1.2435. While remaining below it, the medium-term bearish trend remains intact.
GBP/USD Daily Chart
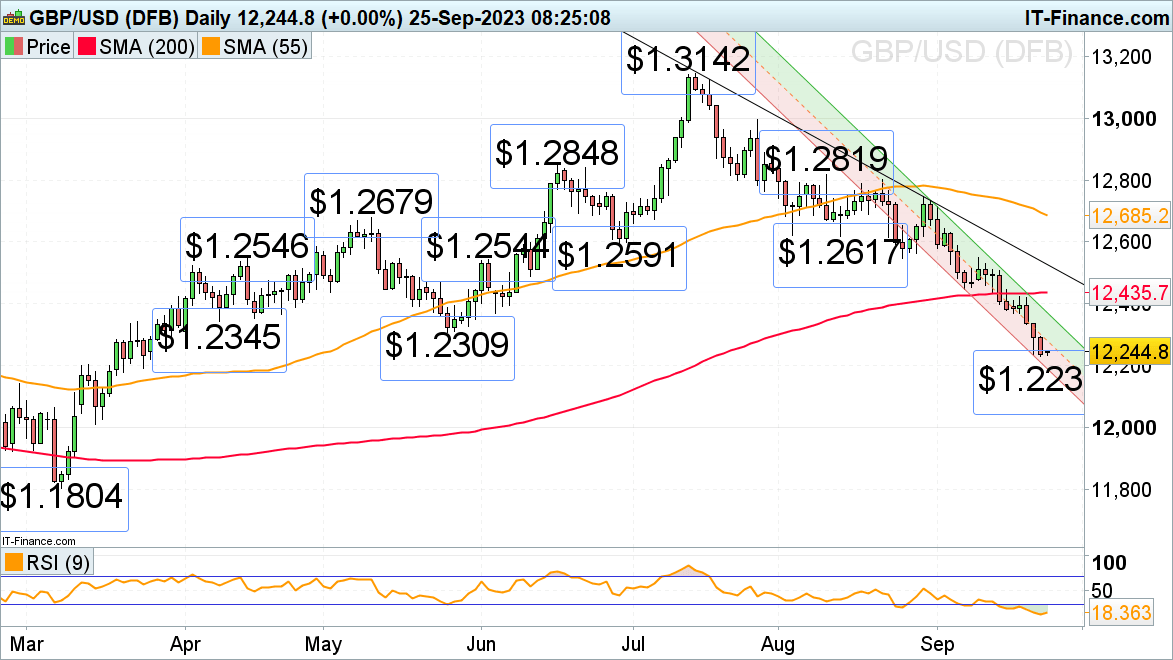
Source: IG, chart created by Axel Rudolph
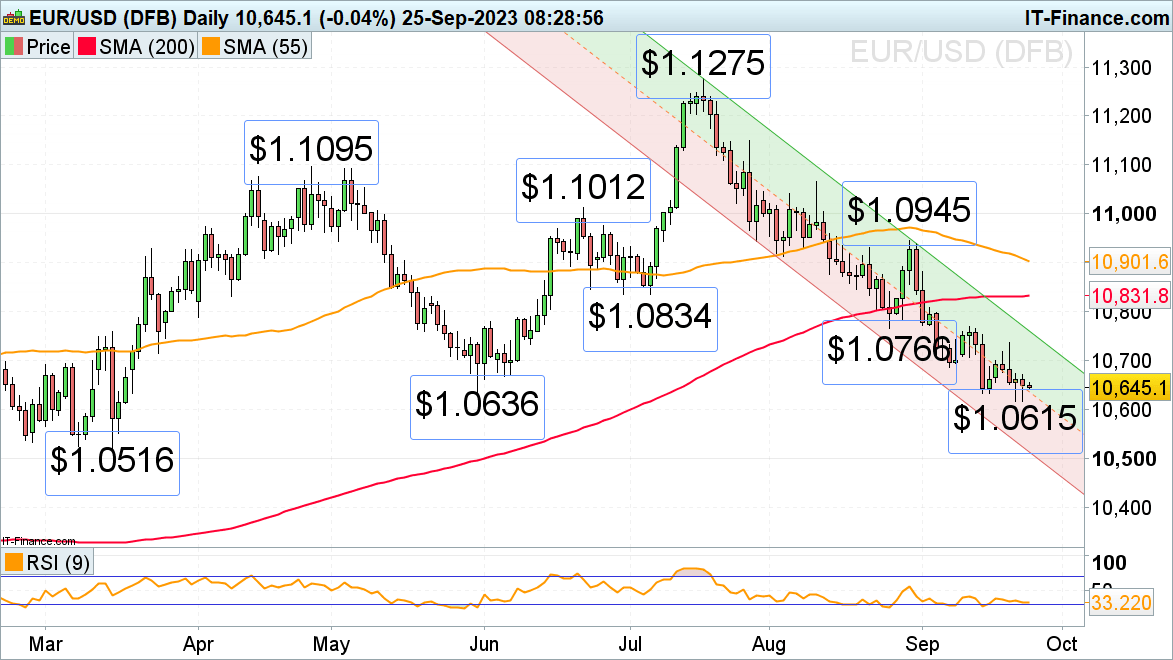
EUR/USD hovers above its 3 ½ month low
EUR/USD continues to hover above its $1.0615 current September low as traders await the German Ifo business climate index and testimony to eurozone lawmakers by the European Central Bank (ECB) president Christine Lagarde.
A fall through and daily chart close below last week’s low at $1.0615 could lead to a slide towards the January and March lows at $1.0516 to $1.0484.
Any potential bounce above Friday’s $1.0671 high is likely to fizzle out ahead of the $1.0766 to $1.0769 late August low and mid-September high.
Source: IG, chart created by Axel Rudolph
Find out the #1 mistake traders make and avoid it! Uncover what makes good traders standout below:

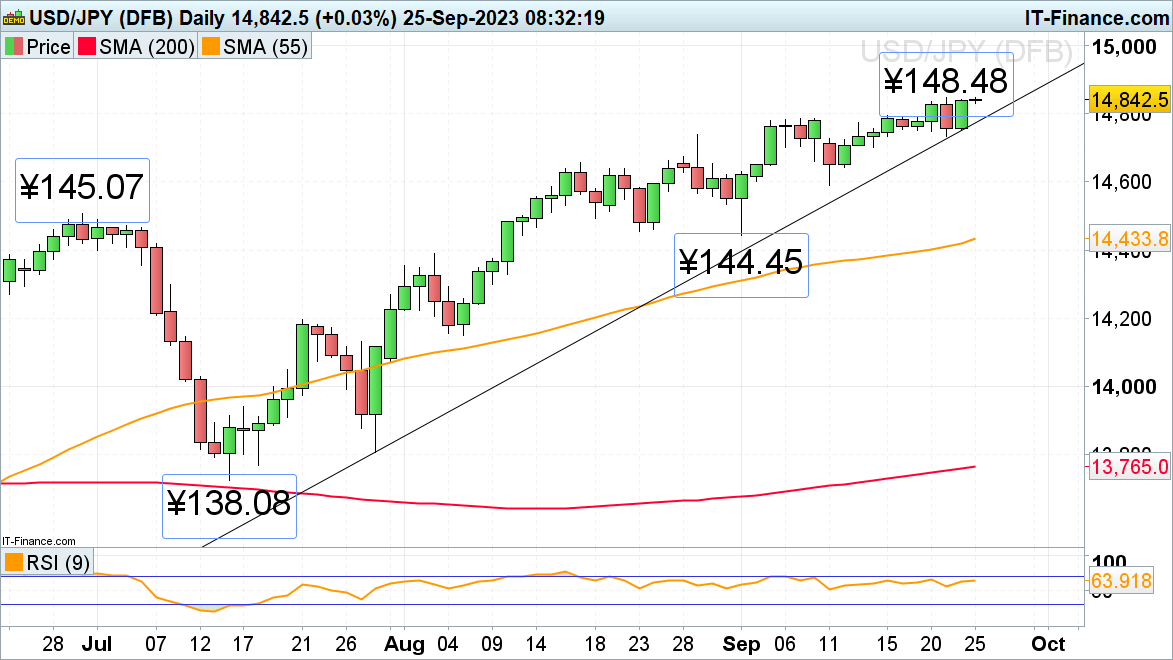
USD/JPY trades in 10-month highs
USD/JPY’s rise is ongoing as the US dollar has seen its tenth consecutive week of gains amid the Federal Reserve’s (Fed) hawkish pause while the Bank of Japan (BOJ) rigorously sticks to its dovish stance and keeps its short-term interest rate at -0.1% and that of the 10-year bond yield at around 0%.
USD/JPY flirts with its 10-month high at ¥148.48, made on Monday morning, a rise above which would put the ¥150.00 region on the map, around which the BOJ may intervene, though.
Immediate upside pressure will be maintained while USD/JPY stays above its July-to-September uptrend line at ¥147.76 and Thursday’s low at ¥147.33. While this minor support area underpins, the July to September uptrend remains intact.
USD/JPY Daily Chart
Source: IG, chart created by Axel Rudolph
| Change in | Longs | Shorts | OI |
| Daily | -8% | -1% | -3% |
| Weekly | -17% | 3% | -3% |