Article by IG Senior Market Analyst Axel Rudolph
FTSE 100, DAX 40, S&P 500 Analysis and Charts
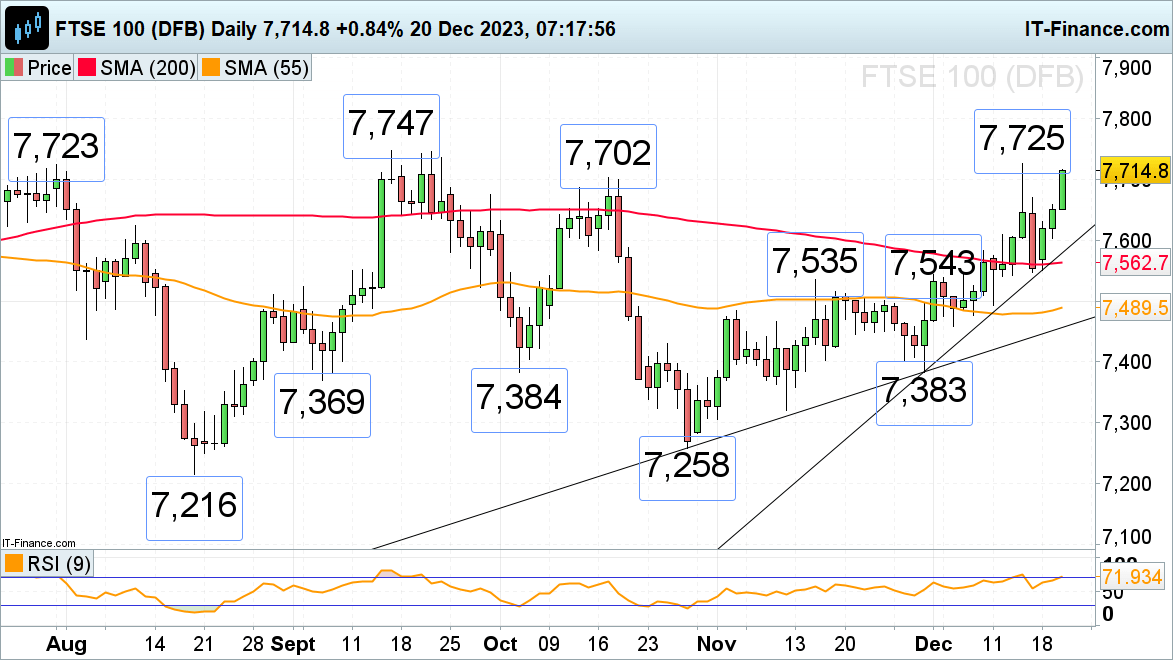
FTSE 100 tries to reach its September peak
The FTSE 100 is on track for its third straight day of gains and has overcome its 7,702 October high while on its way to its near three-month high at 7,725 as UK inflation comes in much lower than expected in November at 3.9% versus a forecast 4.4% and 4.6% in October. Core inflation dropped to 5.1% versus a forecast of 5.6% and a previous reading of 5.7%.
Above 7,725 beckons the September peak at 7,747.
Potential slips should find support around Friday’s 7,670 high and at Tuesday’s 7,658 high.
FTSE 100 Daily Chart
See how daily and weekly changes in sentiment can affect FTSE 100 price action
| Change in | Longs | Shorts | OI |
| Daily | -14% | 5% | 2% |
| Weekly | -6% | 11% | 8% |
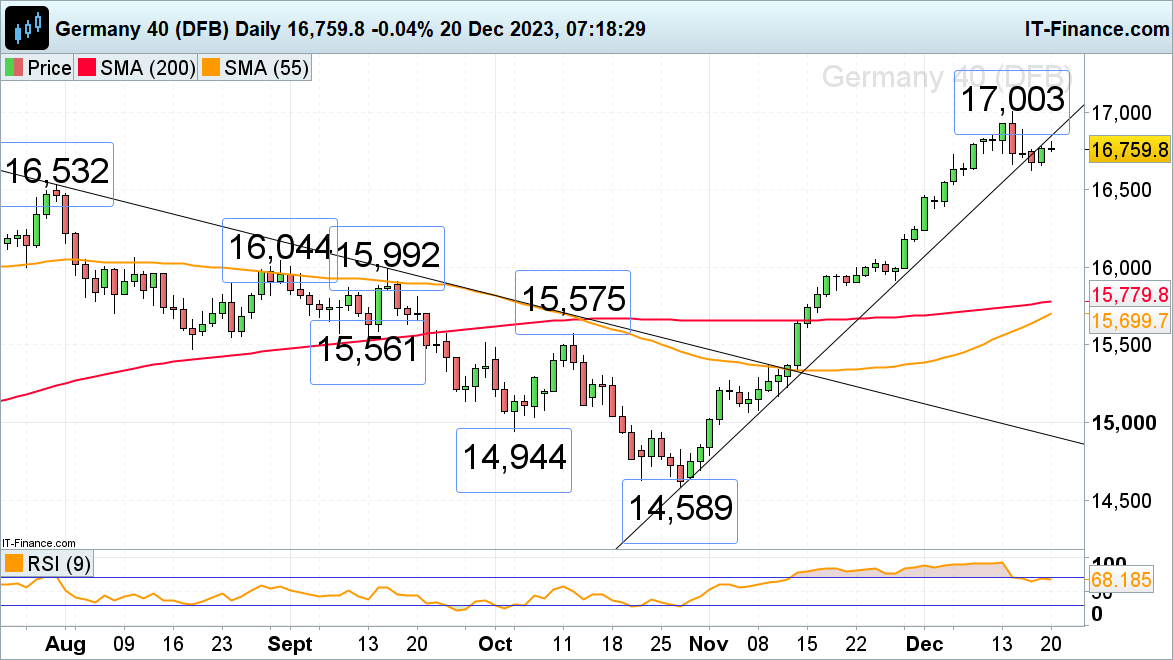
DAX 40 consolidates below last week’s all-time record high
The DAX 40, which led the way to its record high at around the 17,000 mark last week, is taking a back seat and consolidates roughly between 16,700 and 16,800 as German GfK consumer confidence, though better than expected, remains at -25.1 and year-on-year PPI comes in worse than expected at -7.9%.
The index now trades below the October-to-December uptrend line at 16,844 which, because of inverse polarity, acts as a resistance line. While it caps, this week’s low at 16,626 might be revisited. A fall through it would eye the July peak at 16,532.
Resistance is seen around the 11 December high at 16,827 and at Friday’s 16,889 high ahead of last week’s peak at 17,003.
DAX 40 Daily Chart.
Learn how to Trade the News with our complimentary guide

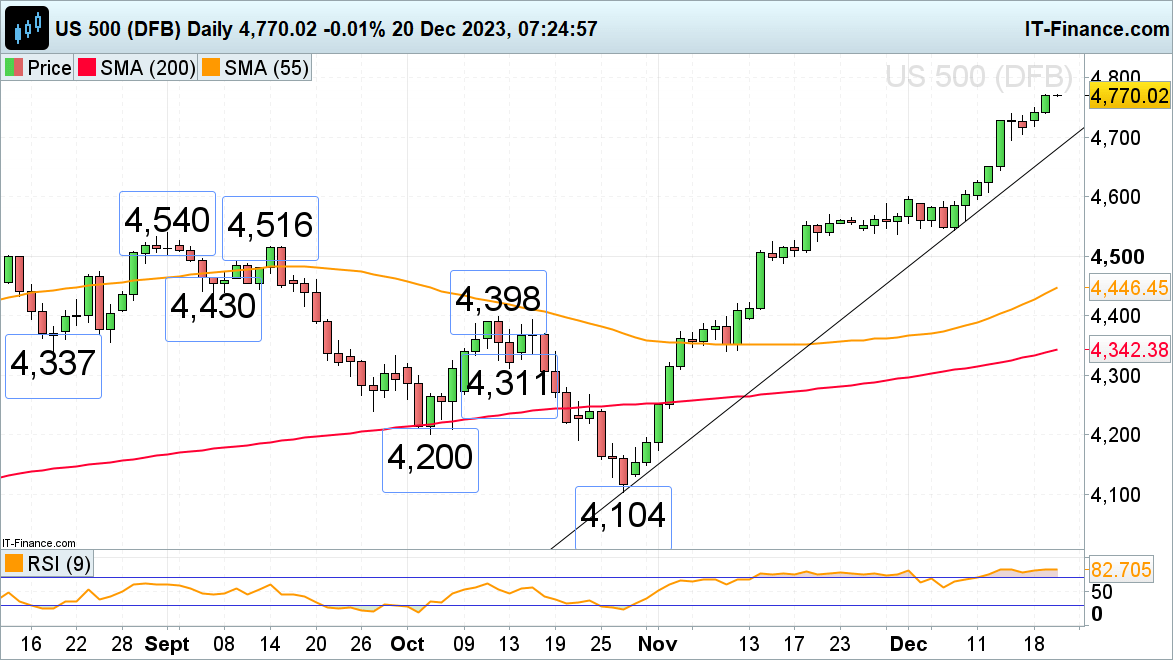
S&P 500 grinds higher still and nears its all-time record high
The S&P’s advance is ongoing with Atlanta Federal Reserve (Fed) President Raphael Bostic’s comment over the lack of "urgency" to remove the restrictive stance being ignored by the financial markets which instead focused on Richmond Fed President Tom Barkin’s comments that the US was making good progress on inflation.
Now that the November and mid-December 2021 highs at 4,743 to 4,752 have been bettered, the S&P 500 is approaching its all-time record high made in January 2022 at 4,817.
Minor support below Monday’s 4,750 high can be spotted at last week’s 4,739 high. Further down lies the 4,694 March 2022 peak at 4,637. While the last few weeks’ lows at 4,544 to 4,537 underpin, the medium-term uptrend stays intact.
S&P 500 Daily Chart