Article written by Axel Rudolph, Senior Market Analyst at IG
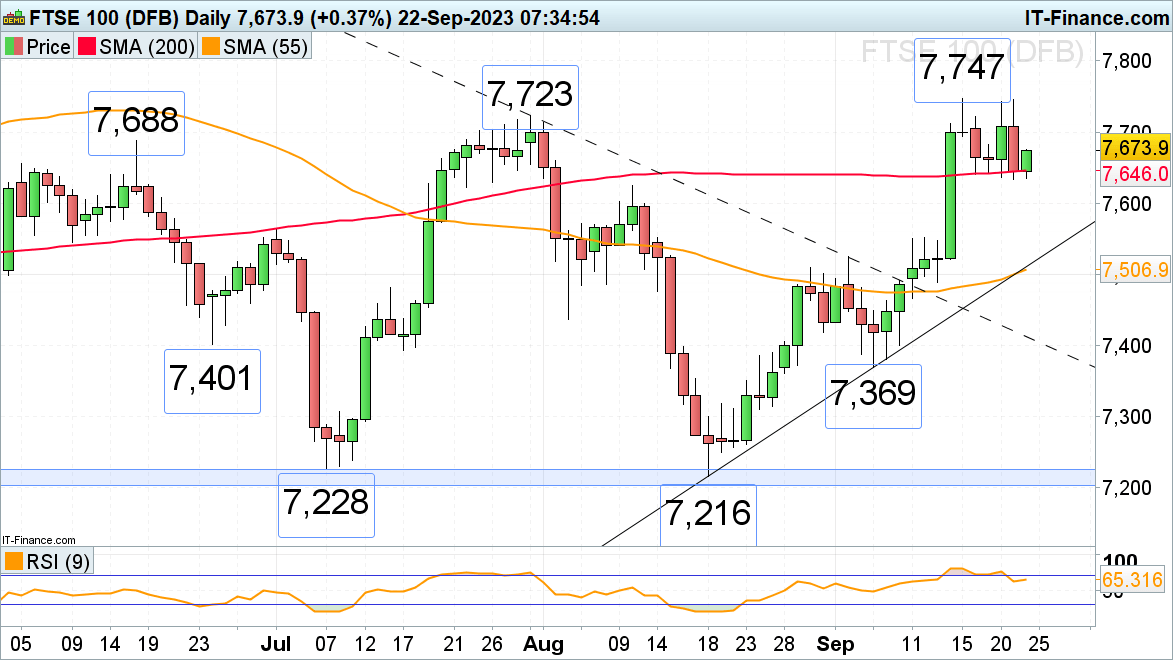
FTSE 100 once more comes off its 3 month high
On Thursday the FTSE 100 tried to overcome last week’s high at 7,747 but failed to do so as heavy selling in the US dragged it down later in the day with the 200-day simple moving average (SMA) at 7,646 once more acting as support.
On Friday morning the FTSE 100 bounced off the moving average and headed towards the 7,688 June high. If bettered, the 7,723 July peak and at last week’s 7,747 high would be back in sight. These highs will need to be overcome for the psychological 7,800 mark and the 7,817 8 May high to be back in play.
A slip through this week’s low at 7,634 would eye the 10 August low at 7,624 and then the early July high at 7,562.
FTSE 100 Daily Chart
source: IG
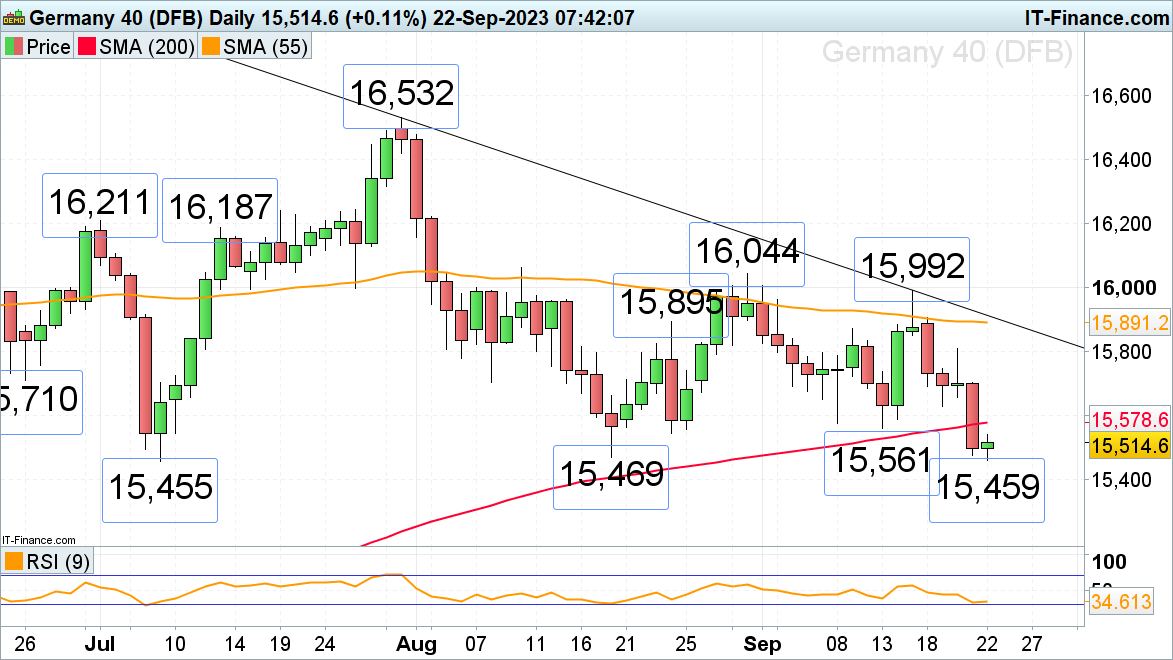
DAX 40 hits three-month low
The DAX 40’s swift 2.5% sell-off this week has taken it to a three-month low with a slip to a six-month low looking probable as major support between the July-to-August lows at 15,469 to 15,455 is threatened.
A further slide would have the mid-January high at 15,272 in its sights.
Were the DAX 40 to once again stabilize, though, it would encounter resistance between the 15,561 mid-September low and the 200-day simple moving average (SMA) at 15,578.
Only a rise and daily chart close above Wednesday’s high at 15,810 would show that this year’s major support zone might once again have held. Unless this high gets exceeded, the risk of another sharp sell-off remains in play.
DAX 40 Daily Chart
source: IG
Find out the #1 mistake traders make and avoid it! IG and DailyFX analysed thousands of live positions to uncover this valuable takeaway:

S&P 500 has seen five consecutive days of declining prices
The US Federal Reserve’s (Fed) hawkish pause provoked a sharp sell-off in US equity indices with the S&P 500 falling to its June low at 4,328 which represents key support.
If fallen through on a daily chart closing basis, the early June low at 4,257 would represent the next downside target ahead of the 200-day simple moving average (SMA) at 4,200.
Any short-term bounce into the weekend would have to grapple with the 4,356 to 4,378 10 July and 25 August lows. More significant resistance can be found between the June and early July highs as well as the 24 August high at 4,447 to 4,474.
S&P 500 Daily Chart
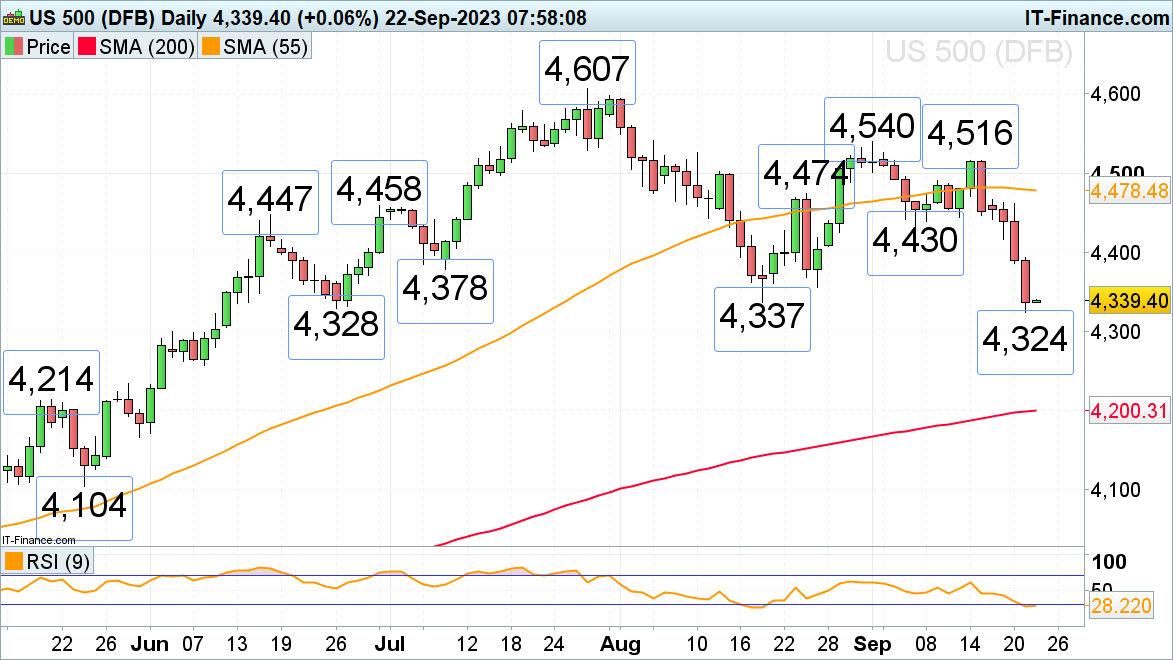
Source: IG
| Change in | Longs | Shorts | OI |
| Daily | -6% | -2% | -4% |
| Weekly | -6% | 3% | -1% |