


Article by IG Senior Market Analyst Axel Rudolph
FTSE 100, DAX 40, S&P 500 Analysis and Charts
Download the Brand New Q4 Equity Outlook

FTSE 100 weighed down by eruption of Middle East conflict
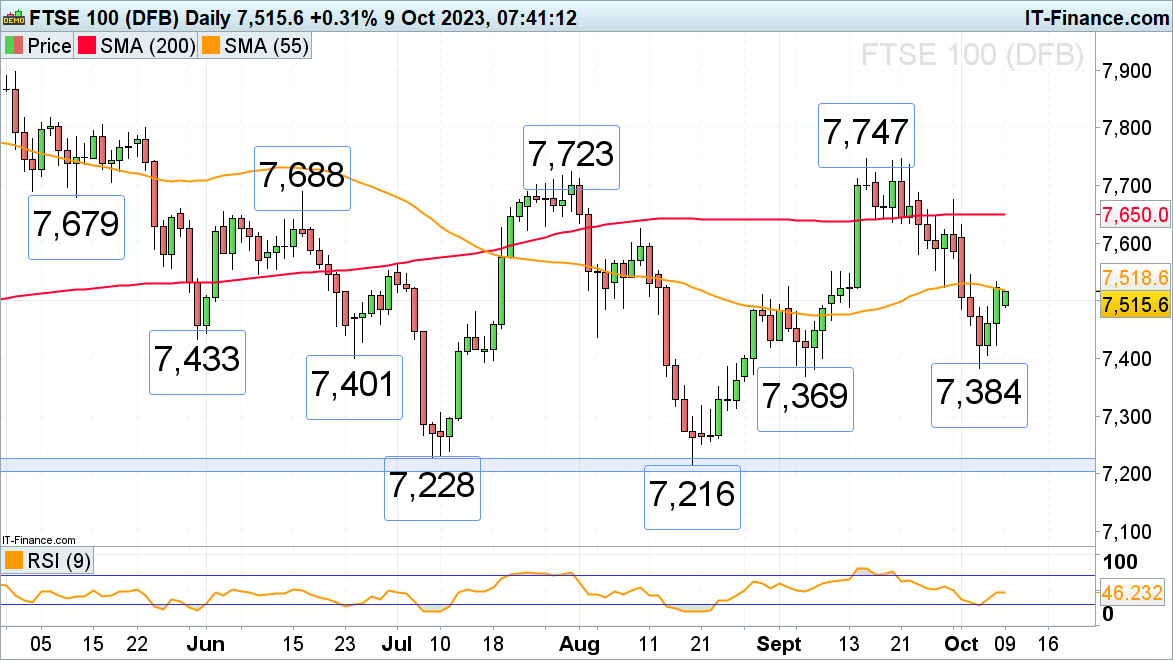
The FTSE 100, which on Friday reached its 55-day simple moving average (SMA) at 7,518, opened the week lower following geopolitical tensions in the Middle East but is being propped up by the higher oil price of around 4%. Technically speaking, provided the FTSE 100 remains above Friday’s 7,422 low, renewed upside is expected to be seen this week, even if accompanied by heightened volatility.
A rise above Friday’s high at 7,532 would lead to the 10 August high and the 200-day simple moving average (SMA) at 7,624 to 7,650 being back on the plate for the upcoming weeks.Only a slip through Friday’s low at 7,422 would put Thursday’s low at 7,405 back on the cards, below which sits Wednesday’s key low at 7,384. It was made marginally above the early September low at 7,369 and together these levels represent important support for the medium-term trend.
FTSE 100 Daily Chart
DAX 40 comes off Friday’s 15,296 high
The DAX 40 has come off Friday’s 15,296 high as the death toll from Hamas’s multi-pronged attack on Israel hit the highest number of civilian casualties within the country’s borders since its founding in 1948. As long as Friday’s low at 15,034 holds, though, last week’s attempt at a rally remains in play. Failure at 15,034 would likely lead to a retest of the psychological 15,000 mark, though, below which last week’s trough can be spotted at 14,944.
Resistance comes in along the September-to-October downtrend line at 15,250 ahead of Friday’s high at 15,296. If overcome, last Monday’s 15,327 low could be hit ahead of major resistance seen between the July and August lows at 15,455 to 15,469.
DAX 40 Daily Chart


S&P 500 so far remains above key support post NFP and Israel conflict
The S&P 500 is expected to gap lower on Monday following geopolitical tensions in the Middle East and may revisit minor support around last Wednesday and Thursday’s highs at 4,269. Below this level, further support can be found at the September 4,239 low. Below it remains the key support zone at 4,224 to 4,187, made up of the early and late May highs and the 200-day simple moving average (SMA). It was revisited but held post-Friday’s US employment report which saw the highest number since February at 336k, nearly double the 170k estimate.
Resistance now sits between the September-to-October downtrend line at 4,312 and the 4,325 to 4,337 late June and August lows, late September as well as Friday’s high.
S&P 500 Daily Chart

Learn How to Build Your Trading Confidence


