Article by IG Senior Market Analyst Axel Rudolph
FTSE 100, DAX 40, S&P 500: Analysis and Charts
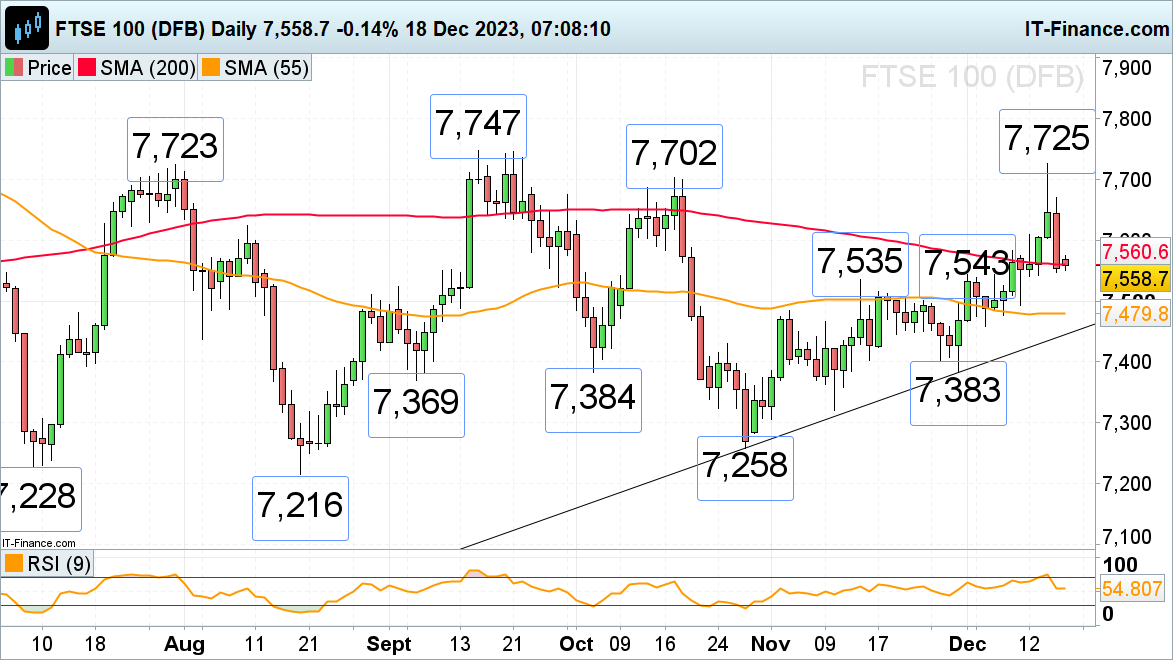
FTSE 100 muted after Friday’s sell-off
Last week the FTSE 100 briefly made a near three-month high at 7,725 before slipping back to the 200-day simple moving average (SMA) at 7,561 despite UK rates remaining on hold but as three of nine voting Bank of England (BoE) Monetary Policy Members (MPC) voted for a further rate hike.
A fall through Friday’s 7,547 low would put the mid-November and early December highs at 7,543 to 7,535 back on the cards.
Resistance above the 8 December high at 7,583 can now be spotted around the 7,600 mark.
FTSE 100 Daily Chart
| Change in | Longs | Shorts | OI |
| Daily | -17% | 9% | 4% |
| Weekly | -5% | 10% | 8% |
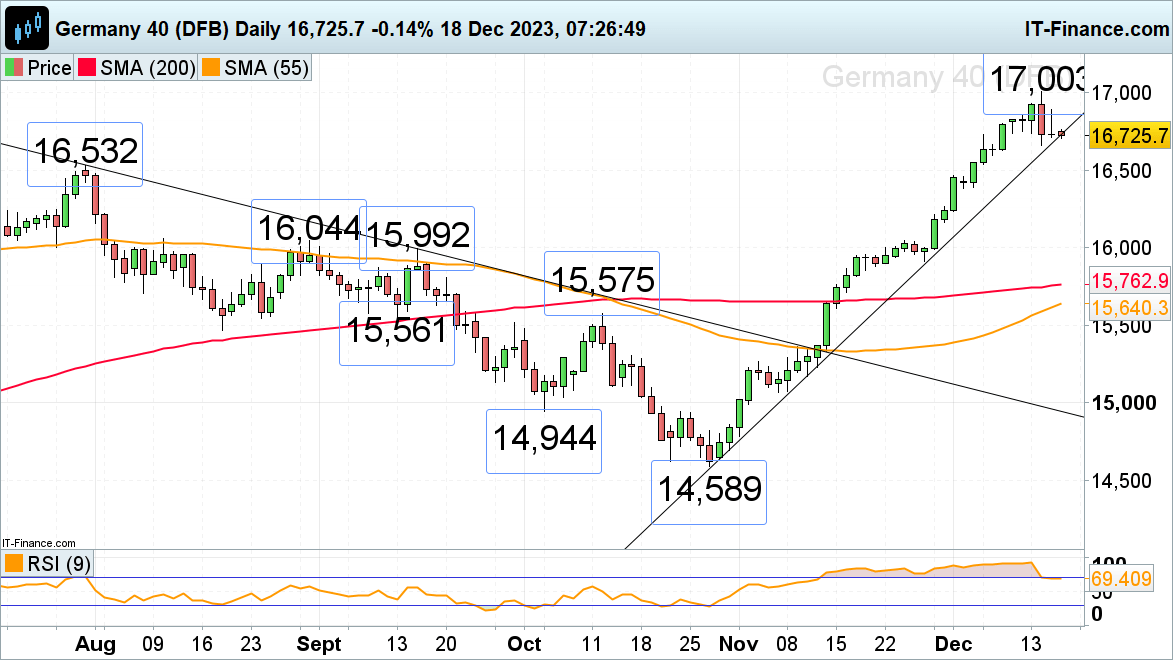
DAX 40 comes off last week’s record high
Following six straight weeks of gains, which took the DAX 40 to its record high at around the 17,000 mark, it is leveling out ahead of today’s German Ifo business climate sentiment and Wednesday’s Gfk consumer confidence.
Below the October-to-December uptrend line at 16,722 and last week’s low at 16,661 lies the July peak at 16,532 which should offer solid support.
Resistance is seen around the 11 December high at 16,827 and at Friday’s 16,890 high ahead of last week’s peak at 17,003.
DAX 40 Daily Chart

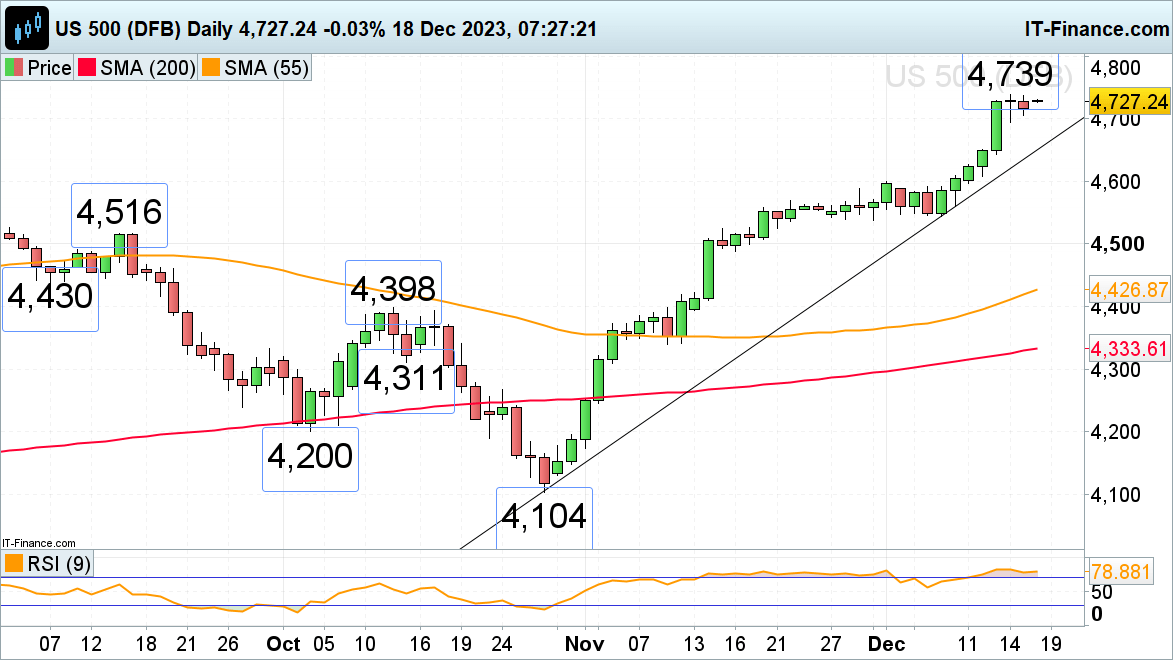
S&P 500 flatlines
The S&P’s steep advance on rate cut expectations has given way to low volatility trading below last week’s 4,739 near two-year high despite 'triple witching' of $5 trillion in expiring options colliding with index-rebalancing of the S&P 500 and the Nasdaq 100.
While Thursday’s low at 4,694 underpins, the November and mid-December 2021 highs at 4,743 to 4,752 will remain in sight ahead of its all-time record high made in January 2022 at 4,817.
Below 4,694 the March 2022 peak at 4,637 may act as support. While the last few weeks’ lows at 4,544 to 4,537 underpin, the medium-term uptrend will remain valid.
S&P 500 Daily Chart