


RAND TALKING POINTS & ANALYSIS
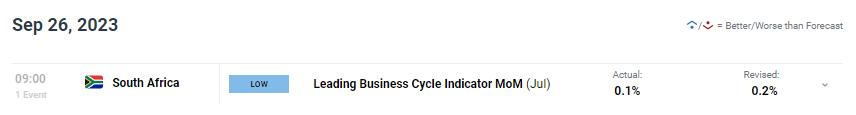
- SA leading business cycle indicator unable to deter ZAR decline.
- US factors influencing rand.
- USD/ZAR pushed off rising wedge support.
Trade Smarter - Sign up for the DailyFX Newsletter
Receive timely and compelling market commentary from the DailyFX team
USD/ZAR FUNDAMENTAL BACKDROP
The South African rand lost roughly 1% to the US dollar after the risk off environment created by higher US Treasury yields saw a rollout of Emerging Market (EM) currencies (refer to chart below). Investors risk aversion has played into the safe haven appeal of the US dollar although the Dollar Index (DXY) is largely flat today. The Fed’s Neel Kashkari added to hawkish bets by suggesting the need for another rate hike in 2023 to limit inflationary pressures.
JP MORGAN EMERGING MARKET CURRENCY INDEX
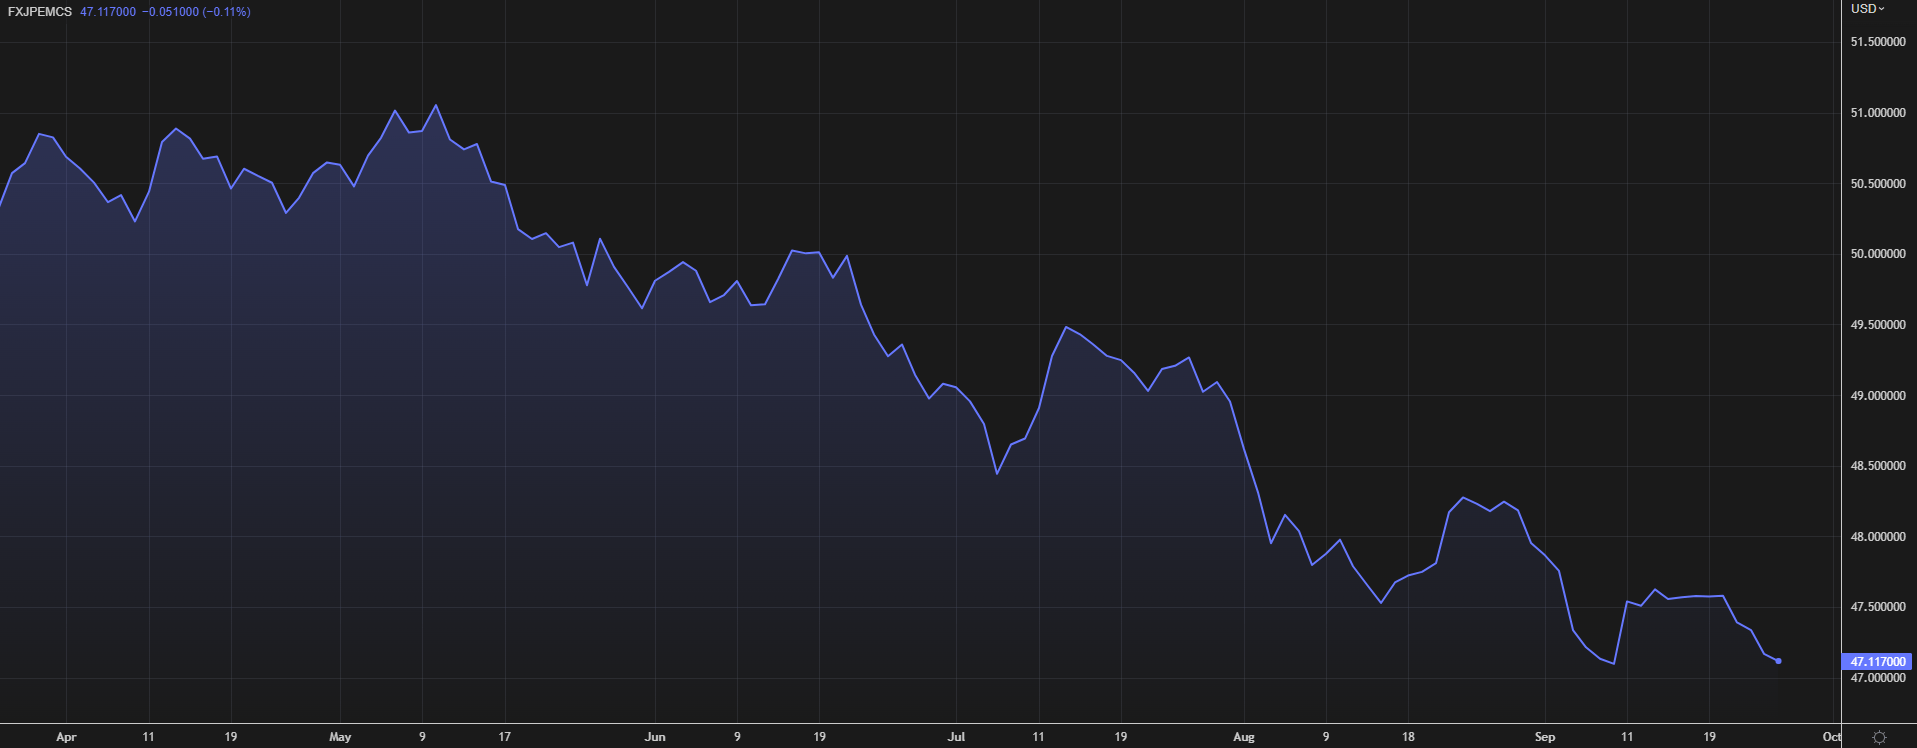
Source: Refinitiv
On a positive note from a South African perspective, the leading business cycle indicator improved for the month of July albeit at a slower rate than the previous print. Coupled with lower stages of rolling blackouts (loadshedding), the economic backdrop is relatively resilient.
LEADING BUSINESS CYCLE INDICATOR – SOUTH AFRICA
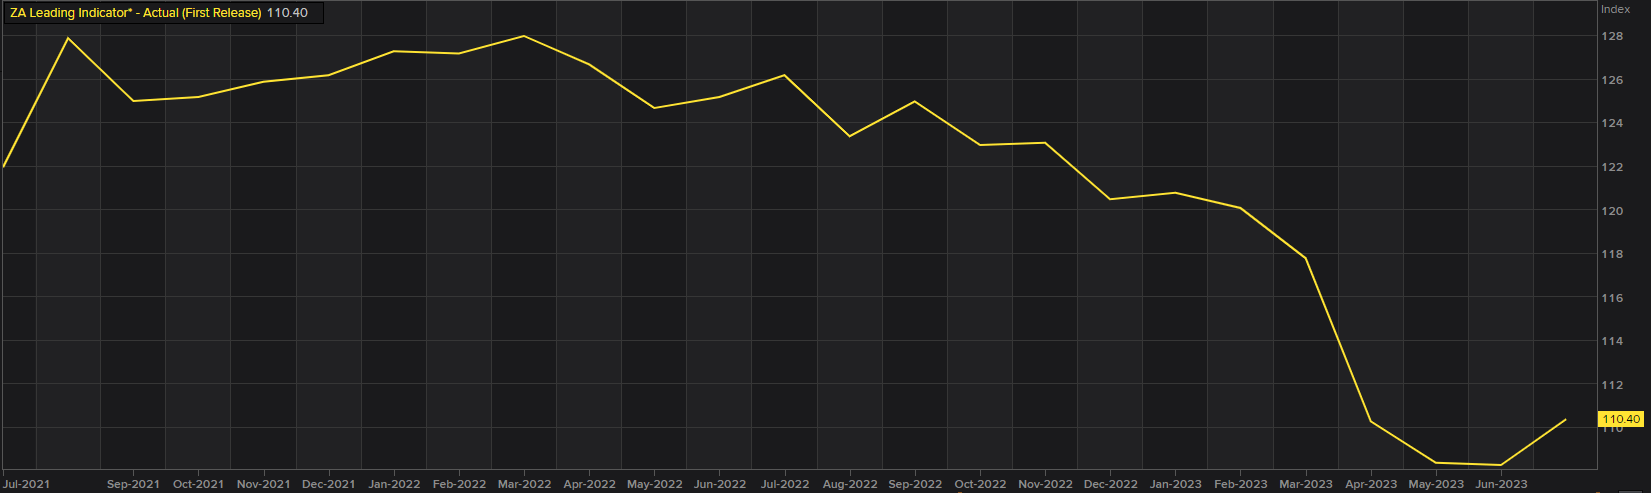
Source: Refinitiv
The trading day ahead will be solely focused on US economic data with particular emphasis on housing data and Fed speak (see economic calendar below).
USD/ZAR ECONOMIC CALENDAR (GMT +02:00)
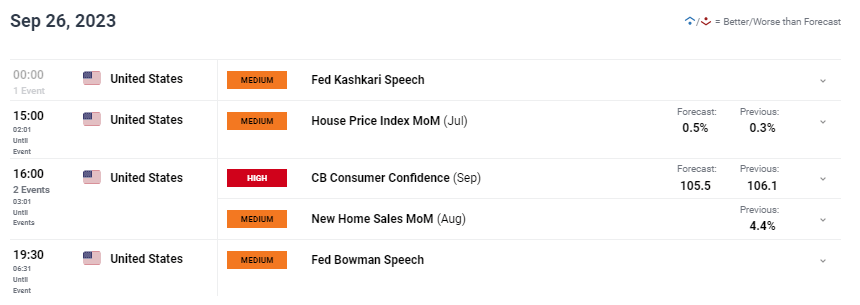
Source: DailyFX Economic Calendar
TECHNICAL ANALYSIS
Introduction to Technical Analysis
Candlestick Patterns
Recommended by Warren Venketas
USD/ZAR DAILY CHART
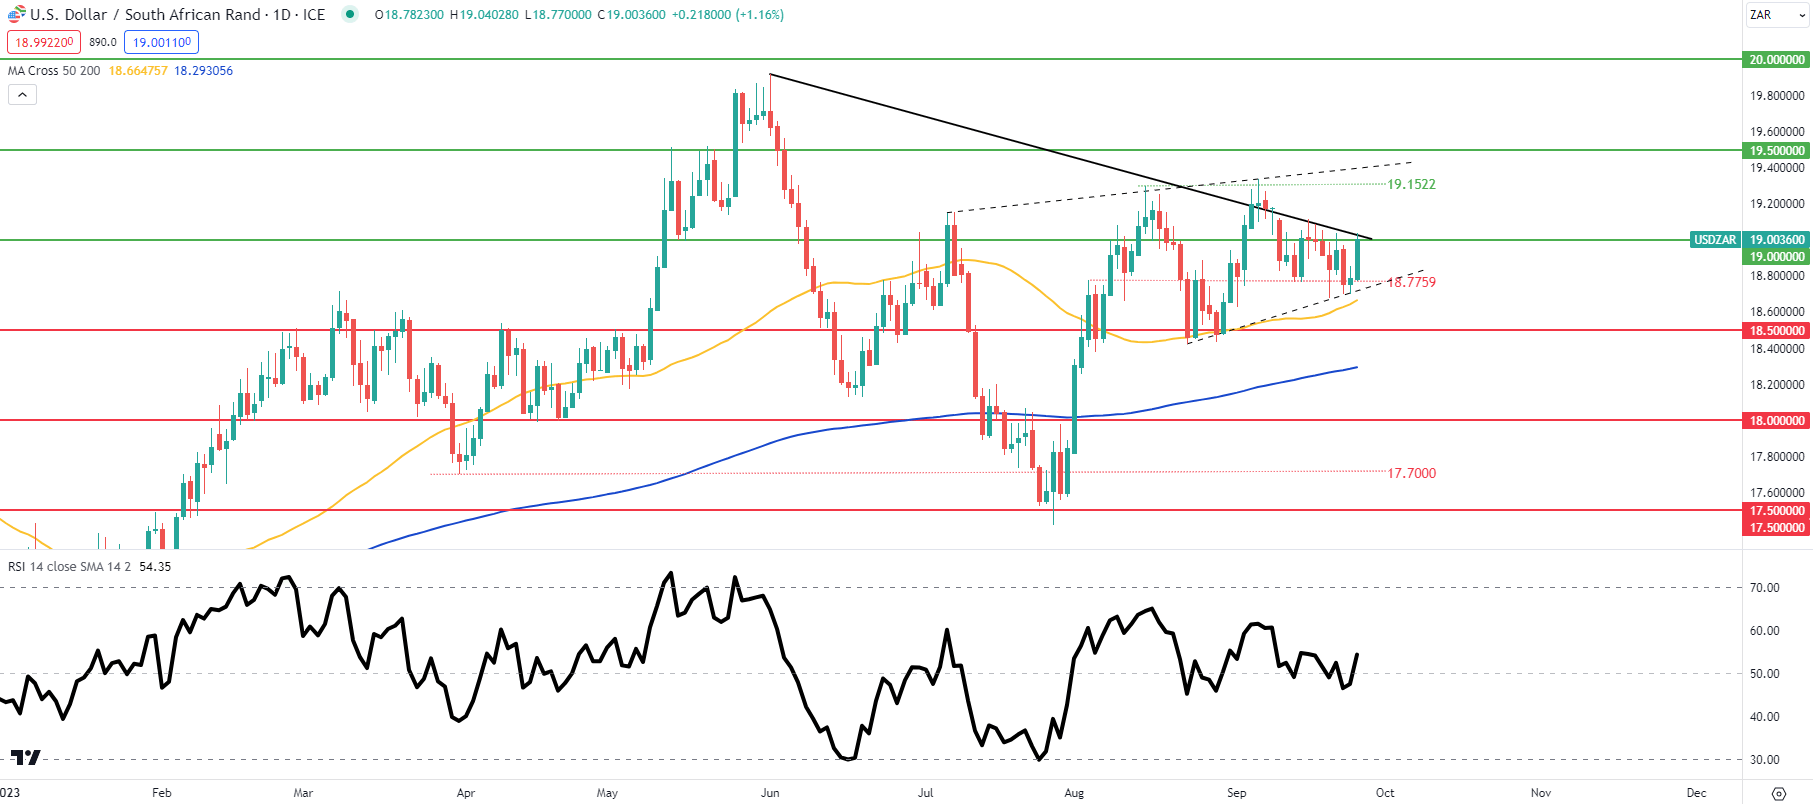
Chart prepared by Warren Venketas, TradingView
Daily USD/ZAR price action has bulls testing the 19.0000 psychological handle once again coinciding with the medium-term trendline support (black). The pair remains within the developing shorter-term rising wedge formation (dashed black line). Bears will be looking for a close below wedge support which could expose the 18.5000 support level.
Resistance levels:
- 19.1522
- Trendline resistance
- 19.0000
Support levels:
- 18.7759
- Wedge support
- 50-day MA (yellow)
- 18.5000
Contact and followWarrenon Twitter:@WVenketas


