
US DOLLAR FORECAST – EUR/USD, USD/JPY, AUD/USD & GOLD
- The U.S. dollar, as measured by the DXY index, rallies on soaring U.S. bond yields
- Powell’s hawkish comments reinforce the greenback’s advance
- This article examines EUR/USD, USD/JPY, AUD/USD and gold prices from a technical standpoint, analyzing key levels to watch in the coming days
Most Read: Gold, Silver Prices Perk Up, Palladium in Freefall, Key Levels for XAU/USD, XAG/USD
The broader U.S. dollar began the session on a subdued tone but rallied in afternoon trading, driven by soaring yields following lackluster demand for U.S. government securities at an important Treasury auction. The greenback's upward momentum was later supercharged by Fed Chair Powell’s hawkish statements during a panel organized by the IMF.
In public remarks, the FOMC chief said that policymakers are not confident that they have achieved a sufficiently restrictive stance to return inflation to the 2.0% target in a sustained manner. He also indicated that further progress on cooling price pressures is not guaranteed and that stronger growth could warrant higher rates. When it was all said and done, the DXY index was up nearly 0.4% on the day.
Taken together, Powell’s comments suggest that the central bank is not 100% convinced that the hiking cycle is over. This could mean another possible hike next month or in January, especially if financial conditions continue to ease, as has been the case since late October (tech stocks have been on a bullish tear ignoring today’s performance).
Will the U.S. dollar top out soon or the recent rally continue? Get all the answers in our Q4 trading forecast guide!

Related: Australian Dollar Forecast - AUD/USD Extends Bearish Reversal in Fakeout Fallout
For the time being, expectations will remain in a state of flux, with sentiment shifting with the strength or weakness of data releases. For this reason, it is imperative that traders keep an eye on the economic calendar in the coming days and weeks. That said, one key report worth following is the October consumer price index survey, due out next Tuesday.
In terms of analysts’ projections, headline CPI is forecast to have risen 0.1% on a seasonally adjusted basis last month, bringing the annual rate down to 3.3% from 3.7% previously. The core gauge, for its part, is seen increasing 0.3% monthly, resulting in a yearly reading of 4.3% - unchanged from September.
With the Fed hypersensitive to incoming information and fearful of inflationary risks, any upward deviation of official data from consensus estimates should boost bond yields and strengthen the case for higher interest rates for longer. This scenario would be positive for the greenback, but negative for gold, the euro, the Australian dollar and the yen.
Curious about the expected path for EUR/USD and the market catalysts that should be on your radar? Explore all the details in our Q4 euro trading forecast. Download it now!

EUR/USD TECHNICAL ANALYSIS
After facing rejection from Fibonacci resistance at 1.0765, EUR/USD has undergone a quick pullback, with the exchange rate now flirting the lower limit of a support band at 1.0650. The bulls must defend this floor at all costs – failure to do so can send the pair reeling, driving prices toward trendline support at 1.0555. On further weakness, the possibility of a retest of the 2023 lows come into view.
In case the market turns and sentiment swings in favor of the bulls, the first technical barrier to watch appears at 1.0765, where the 200-day simple moving average aligns with the 38.2% Fib retracement of the July/October decline. Overcoming this confluence of key levels could reinforce the bullish momentum, paving the way for a move towards 1.0840.
EUR/USD TECHNICAL CHART

EUR/USD Chart Created Using TradingView
Gain insights into the Japanese yen's fundamental and technical outlook by downloading our free Q4 trading forecast today.

USD/JPY TECHNICAL ANALYSIS
USD/JPY pulled back last week, but has reasserted its upward momentum, taking out an important ceiling at 150.90 and charging towards its 2022 and 2023 highs, just shy of the psychological 152.00 mark. With prices on a bullish tear and approaching an important tech zone, traders should exercise caution as Tokyo may step in any minute to curb speculative activity and prevent further yen depreciation.
In the event of FX intervention by Japanese authorities, USD/JPY could quickly sink below 150.90 and head towards the 149.00 handle. On further weakness, the focus shifts to 147.25, followed by 146.00. If Tokyo stays out of currency markets and allows the exchange to drift above 152.00, a potential rally towards the upper boundary of a medium-term rising channel at 153.40 becomes conceivable.
USD/JPY TECHNICAL CHART
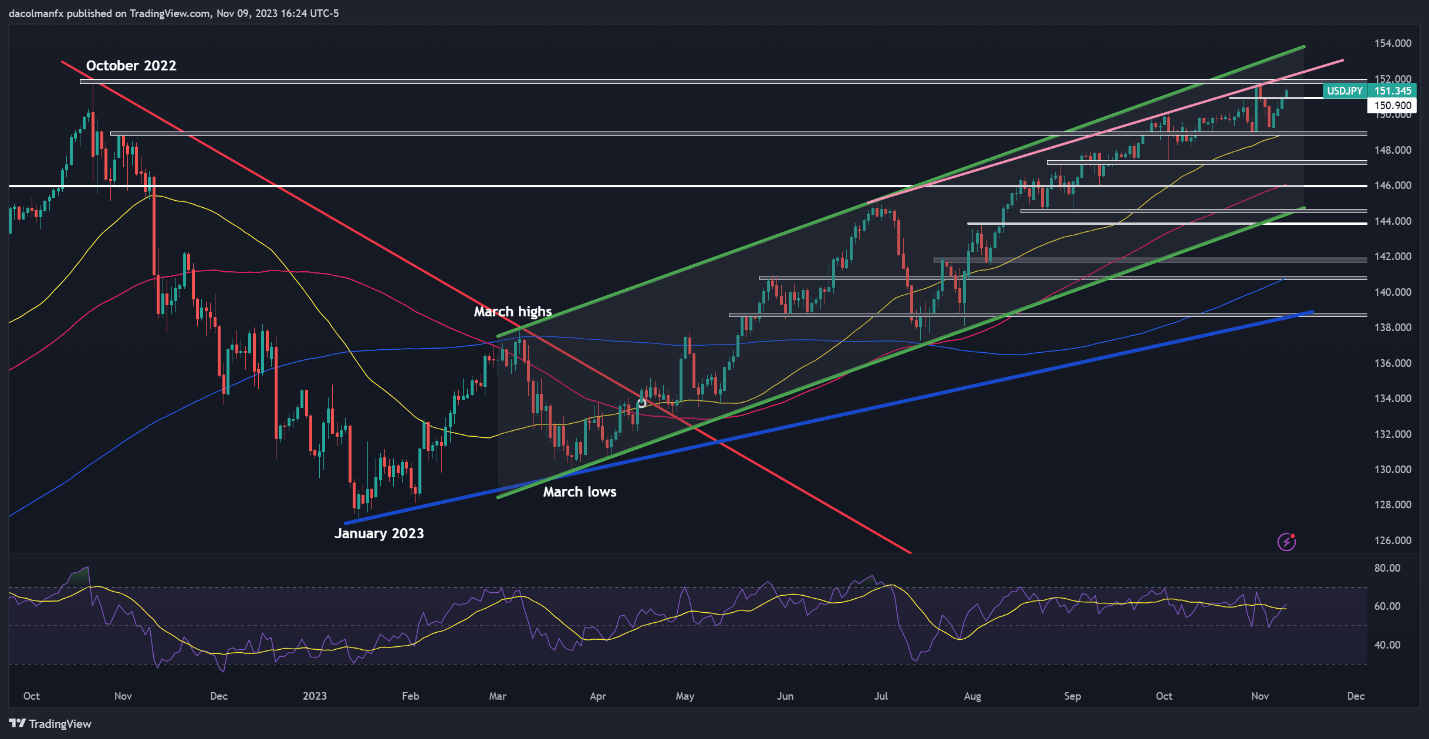
USD/JPY Chart Created Using TradingView
Interested in learning how retail positioning can shape the short-term trajectory of the Australian Dollar? Our sentiment guide has the information you need—download it now!
| Change in | Longs | Shorts | OI |
| Daily | -25% | 23% | -7% |
| Weekly | -20% | 19% | -4% |
AUD/USD TECHNICAL ANALYSIS
AUD/USD fell for the fourth straight session on Thursday, erasing all gains accumulated following last week’s bullish breakout, which turned out to be a fakeout. After this pullback, the pair has arrived at an important support near 0.6350. The integrity of this area level is vital; a failure to maintain it could result in a drop towards 0.6325. On further weakness, a revisit to this year's lows could be in the cards.
Despite the recent setback for the Australian dollar, the bullish scenario should not be entirely dismissed. That said, if the bulls engineer a comeback and trigger a rebound off current levels, overhead resistance appears around the 0.6400 handle, followed by 0.6460. Successfully overcoming this technical barrier could reignite bullish momentum, opening the door for a rally toward the November highs near 0.6500.
AUD/USD TECHNICAL CHART
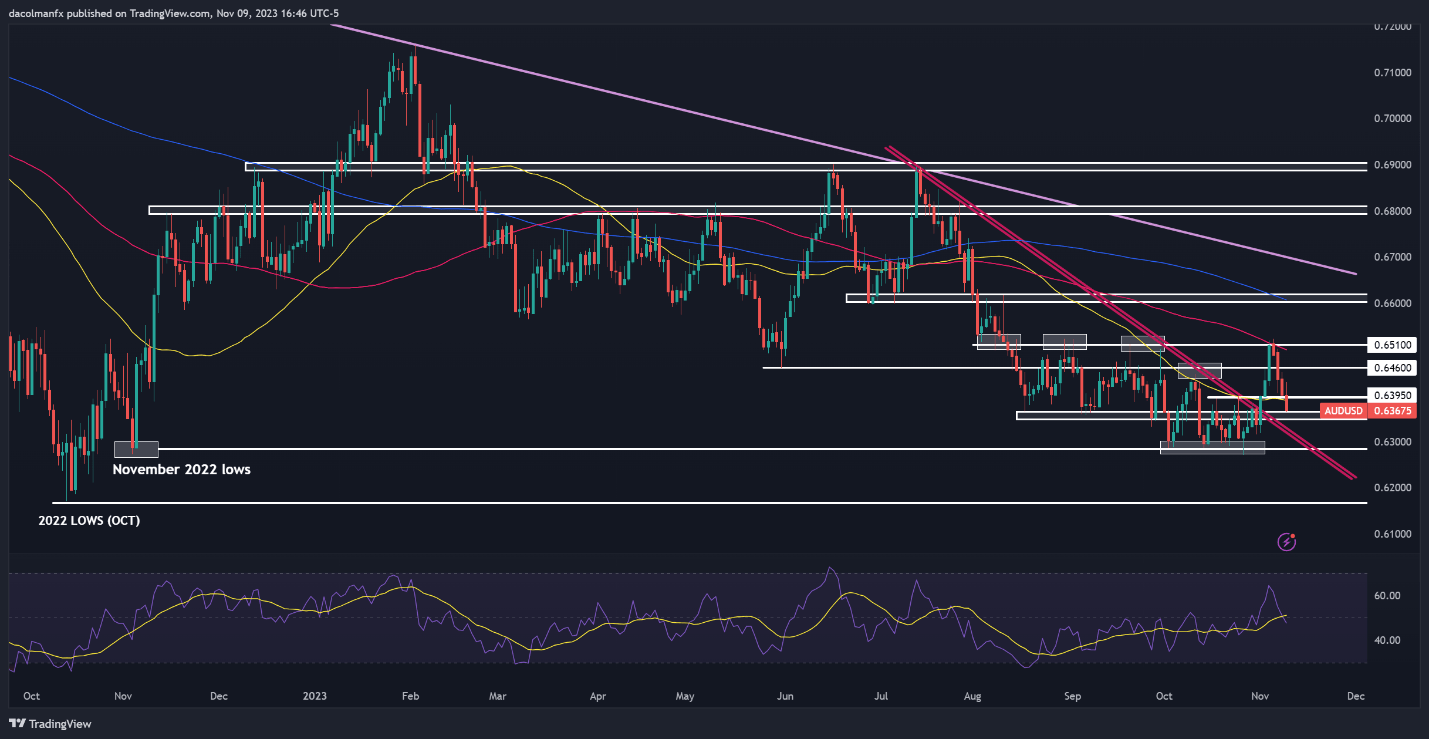
AUD/USD Chart Created Using TradingView
Wondering how retail positioning can shape gold prices? Our sentiment guide provides the answers you seek—don't miss out, download it now!
| Change in | Longs | Shorts | OI |
| Daily | -4% | -4% | -4% |
| Weekly | 2% | -9% | -3% |
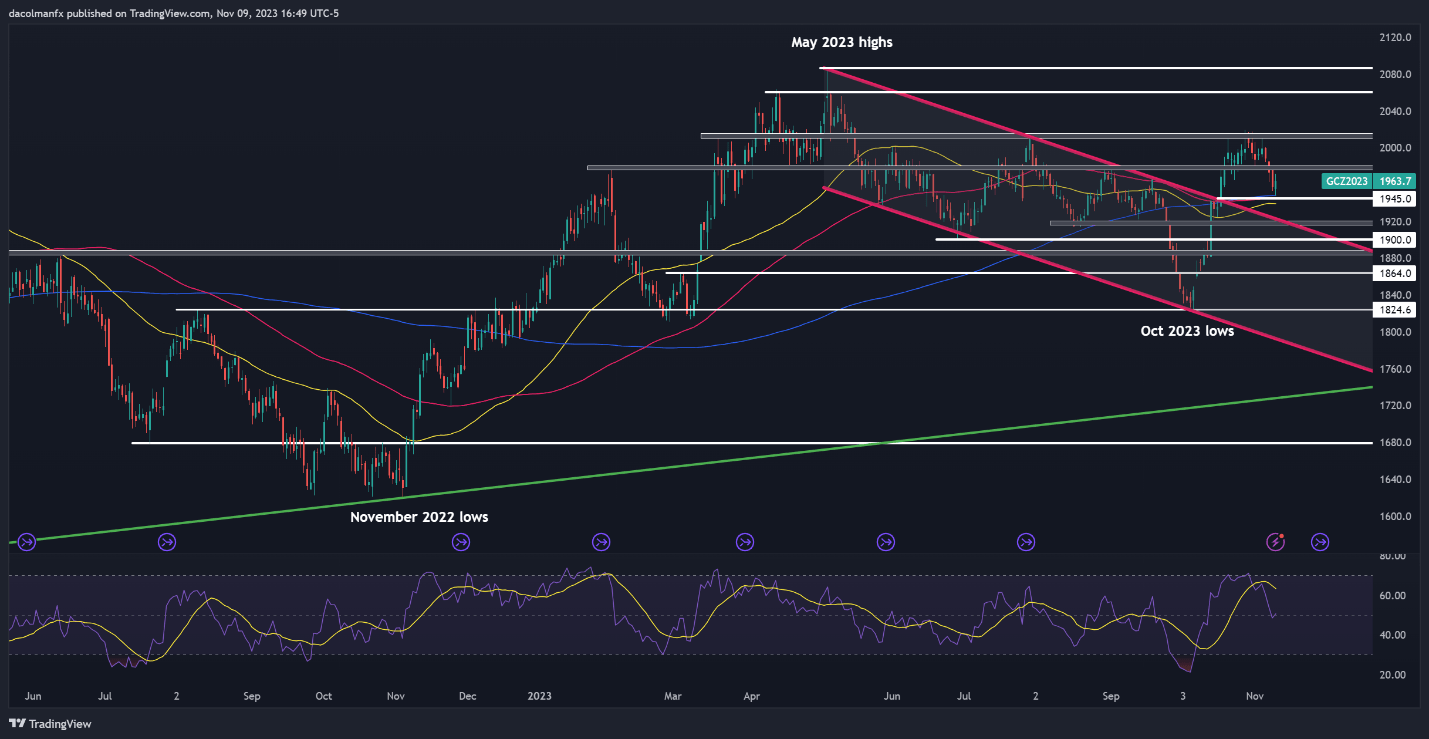
GOLD TECHNICAL ANALYSIS
Earlier this week, gold reversed lower when the bulls failed to take out a critical ceiling in the $2,010/$2,015 area. However, XAU/USD has started to perk up after this setback, with prices encountering support around the 200-day simple moving average ahead of a modest bounce. If gains pick up pace in the coming trading sessions, initial resistance appears at $1,980, followed by $2,010/$2,015.
Conversely, if sellers return and regain the upper hand in financial markets, the first floor to monitor is positioned at $1,945, which aligns with the 200-day SMA. Although gold might find a foothold in this region during a pullback, a breakdown could prompt a descent towards $1,920. Below this region, the focus transitions to $1,900.
GOLD PRICE CHART (FUTURES CONTRACTS)