
MARKET RECAP
The U.S. dollar, as measured by the DXY index, retreated on Wednesday, dragged lower by falling rates in the wake of disappointing economic numbers. U.S. Treasury yields have begun to retrench in recent days, as softer-than-expected macro-related statistics have reduced the likelihood of additional monetary tightening by the Federal Reserve.
Earlier this week, U.S. job openings and consumer confidence brought forth negative surprises. Today, private payroll figures (ADP) for August followed the pattern of lackluster data, clocking in at 177,000 versus a forecast of 195,000. The second estimate of Q2 GDP also fell short of predictions, recording a growth rate of 2.1% annualized, in contrast to the projected 2.4%.
US ECONOMIC DATA
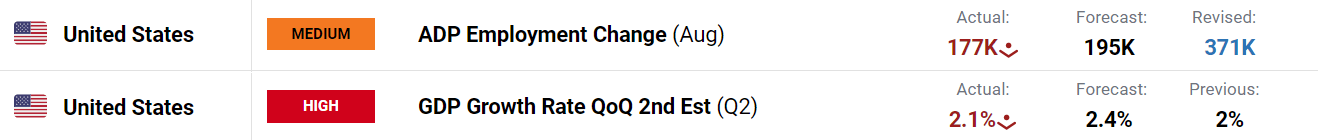
Source: DailyFX Economic Data
Although the outlook is fluid and subject to change, emerging signs that the economy is slowing rather than reaccelerating may force the Fed to adopt a more cautious stance at upcoming meetings, deterring officials from pursuing further policy firming. This could create a bearish setting for the U.S. dollar, but traders should remain attentive to the August NFP report and the ISM survey to validate this analysis.
Trade the U.S. dollar like a pro. Download the third-quarter USD trading guide for key insights and strategies

US DOLLAR (DXY) TECHNICAL ANALYSIS
Focusing on technical analysis, the U.S. dollar rallied from mid-July through late August to multi-month highs, but failed to clear trendline resistance near 104.50. Once the DXY index reached this threshold, sellers regained control of the market, triggering a moderate pullback in subsequent sessions, with prices threatening to break below the 200-day simple moving average at 103.00 the time of writing.
In terms of possible scenarios, if prices manage to breach the 103.00 floor, the bears may launch an assault on the psychological 102.00 level, followed by 100.80. On the flip side, if the US dollar regains poise and turns higher, initial resistance appears at 103.50, and 104.25 thereafter.
US DOLLAR TECHNICAL CHART
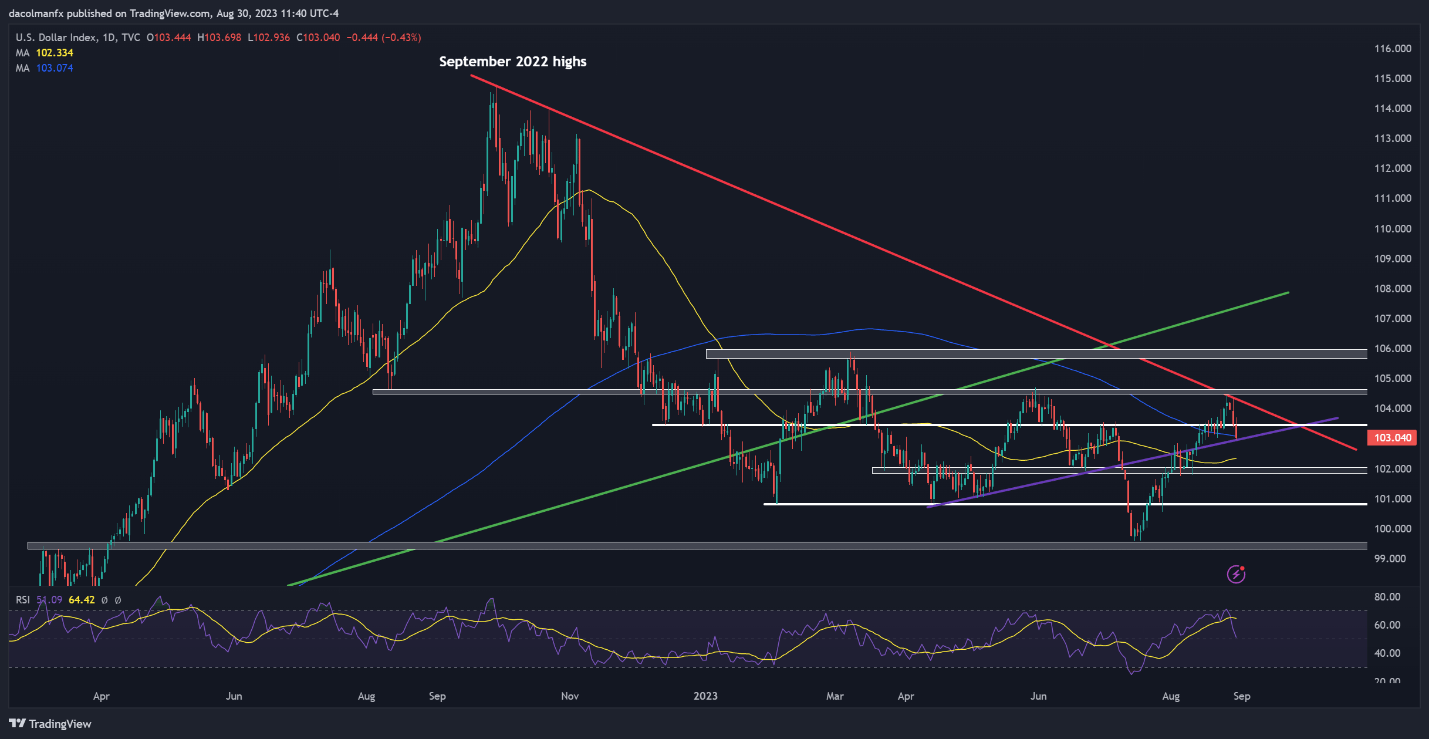
US Dollar (DXY) Chart Created Using TradingView
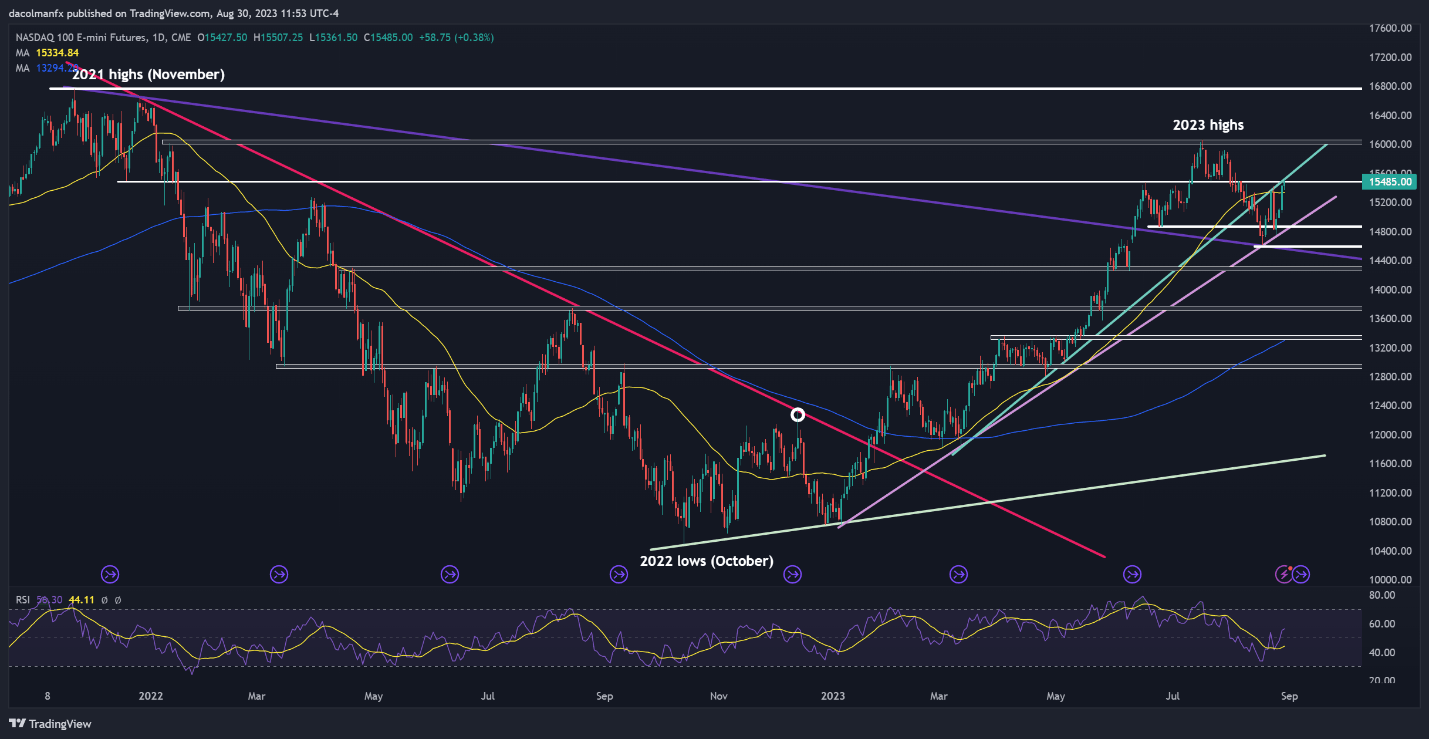
NASDAQ 100 TECHNICAL ANALYSIS
After some indecision at the market open on Wednesday, the Nasdaq 100 ultimately leaned towards gains in afternoon trading, rising for the fourth consecutive session to the doorstep of a major technical resistance located near 15,500. While clearing this barrier might prove challenging, a clean and decisive breakout could significantly bolster bullish momentum, paving the way for a retest of the 2023 highs around 16,000.
Conversely, if upward impetus fades and sellers return, the tech index could slip below its 50-day moving average, creating favorable conditions for a slump toward trendline support at 14,850. Although the Nasdaq 100 may establish a base in this region on a pullback, a breakdown has the potential to amplify downward pressure, potentially leading to a decline toward the 14,600 mark.
Stay ahead of important trends. Download your third-quarter Nasdaq 100 outlook and start trading with more confidence

NASDAQ 100 TECHNICAL CHART