


Eager to gain a better understanding of where oil prices are headed and the technical drivers shaping the trend in energy markets? Download our Q1 trading forecast for enlightening insights!

The weekly chart for 2023 gives us perhaps the clearest picture of where the oil market stands heading into the new year. A broad trading band between $70 and $83/barrel contained market action for the vast majority of the year, and was traded back into fairly rapidly whenever it was broken, with only an eight-week upside breakout between August and October threatening the pattern.
Another foray to the downside seems to have been checked and there seems little reason to think that the range base would be abandoned for long even if it should give way in the early sessions of 2024.
WTI Crude Oil Weekly Chart
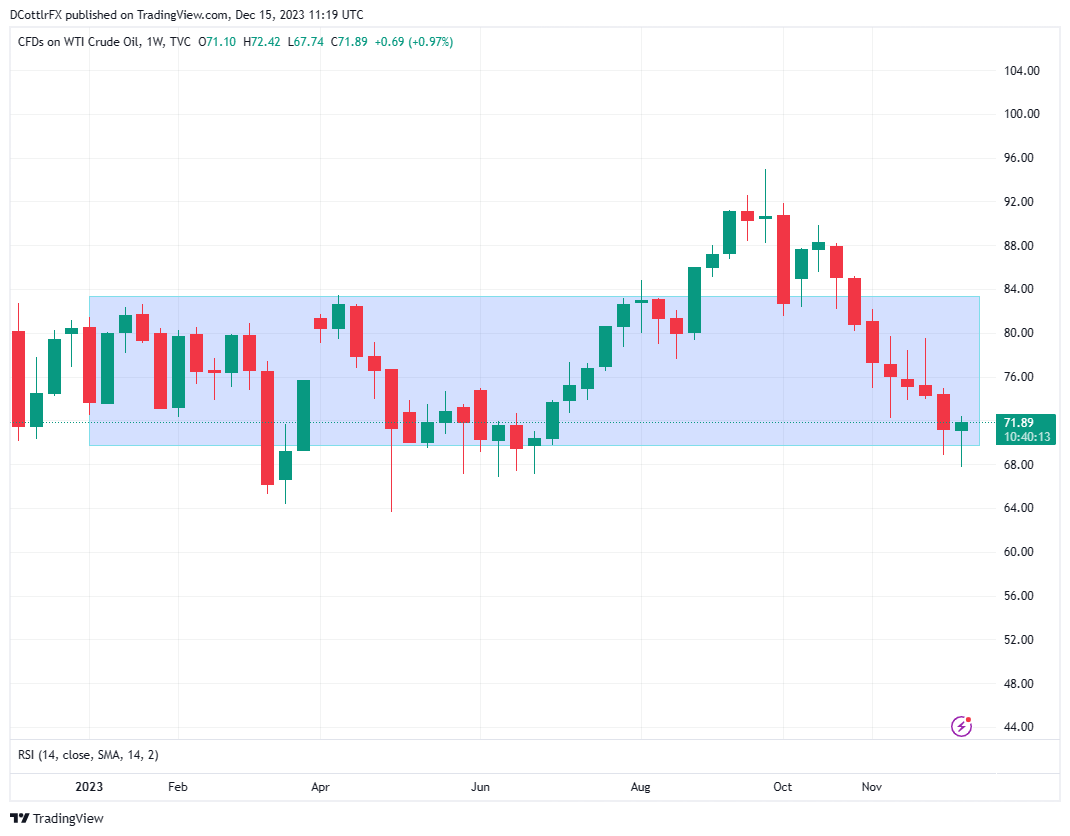
Source: TradingView, Prepared by David Cottle
The daily chart offers a little more detail, showing prices stuck between the fifth Fibonacci retracement of their rise up to those September peaks from the lows of June 28 and complete erasure of the entire rise.
That retracement level comes in at $73.07, with complete retracement still acting as support at $67.10. Still, for all that prices seem to be stabilizing, bulls are going into 2024 with plenty of work to do. WTI remains very much within the downtrend channel established on September 28 and won’t break out of it until it can top the $74.50 mark.
The WTI market has recovered quite well from the oversold levels seen back in early December, and this more relaxed picture suggests that there could be more room for gains.
The technical picture overall chimes with the fundamentals to suggest that crude heads into 2024 holding above its recent lows but most unlikely to challenge the old year’s peaks without a major shift in market dynamics.
Wondering how retail positioning can shape oil prices? Our sentiment guide can help you clarify your doubts—don't miss out, download it now!
| Change in | Longs | Shorts | OI |
| Daily | 4% | -11% | 1% |
| Weekly | 37% | -33% | 14% |
WTI Crude Oil Daily Chart
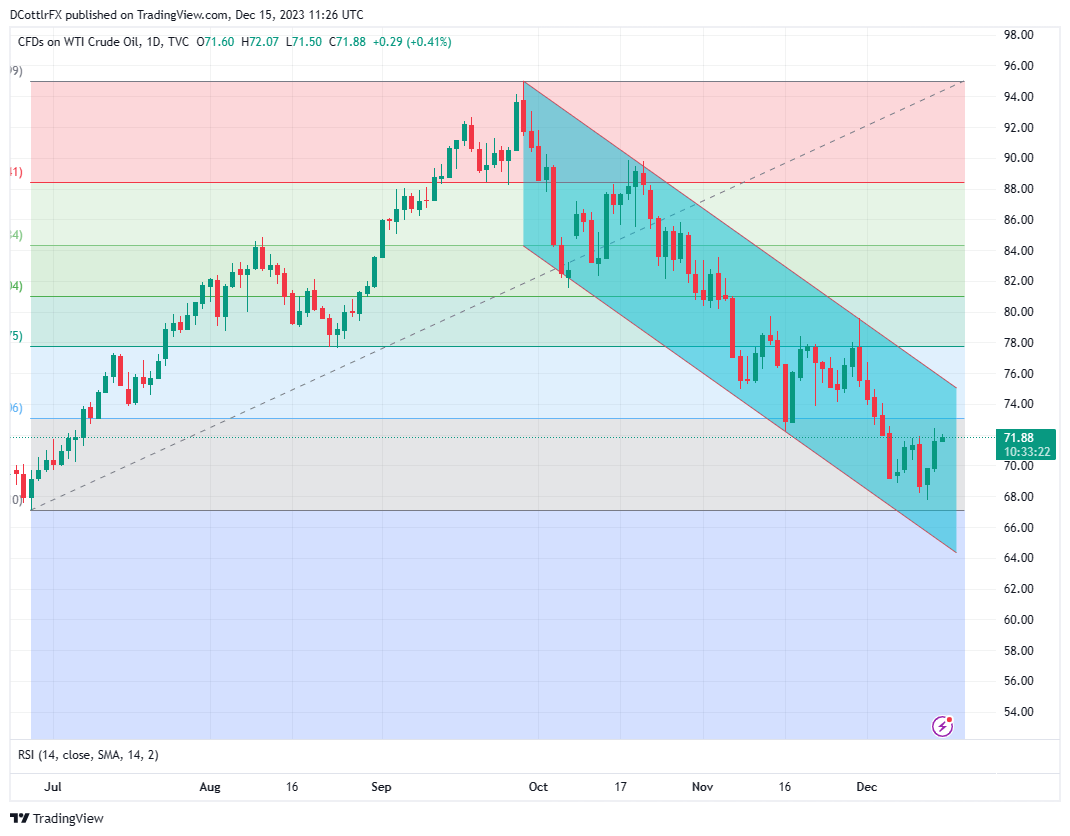
Source: TradingView, Prepared by David Cottle


