


Crude Oil Price, Chart, and Analysis
• Oil prices recovered a little poise after Monday’s slide.
• But worries over global demand in a world of higher interest rates are clear.
• Price forecasts have been lowered.

Crude oil prices inched a little higher in Asia and Europe on Tuesday but have so far come nowhere near recovering the previous session’s steep falls.
The market continues to wrestle with the gloomy prospect of plentiful global supply meeting extremely shaky demand. The latter is exacerbated by signs that China’s near-term energy needs aren’t even close to their pre-Covid peaks even as the economy shows signs of recovery.
Goldman Sachs cut its oil price forecasts last weekend, blaming higher-than-expected supply levels this year and into next. It now forecasts Brent at $86/barrel at the end of this year, down from a previous call of $95. It tips the US benchmark West Texas Intermediate at $81, down from $89.
Oil-price weakness has some analysts suggesting that Saudi Arabia could extend its own heavy supply cuts into July and perhaps beyond. The country said last week it would reduce production by a million barrels per day in an effort to support prices. This was the heaviest such cut in years.
The oil market like all others is in thrall to this week’s slew of interest-rate decisions from key central banks. The Bank of Japan and the European Central Bank will both be heard from, but of course, it’s the US Federal Reserve’s call on Wednesday that tops the bill. A nervy money market expects the Fed to stop hiking rates for the first time in eleven meetings. However, given the stubbornness of global inflation, it’s by no means certain that this historic cycle of monetary tightening is over in the US, and it’s all but certainly got much further to run in Europe. Rates have already risen again this month in Canada and Australia.
Rate-rises already undertaken in the US have weighed on the energy market, both by supporting the US dollar and making goods denominated in it pricier for third-country buyers and by weakening overall demand. With this in mind, the market will be on the watch for any sign of how long a pause in the Fed’s hiking cycle could last, even if they’re highly unlikely to get a definitive steer.
Trade Smarter - Sign up for the DailyFX Newsletter
Receive timely and compelling market commentary from the DailyFX team
US Crude Oil Technical Analysis - Daily Price Chart
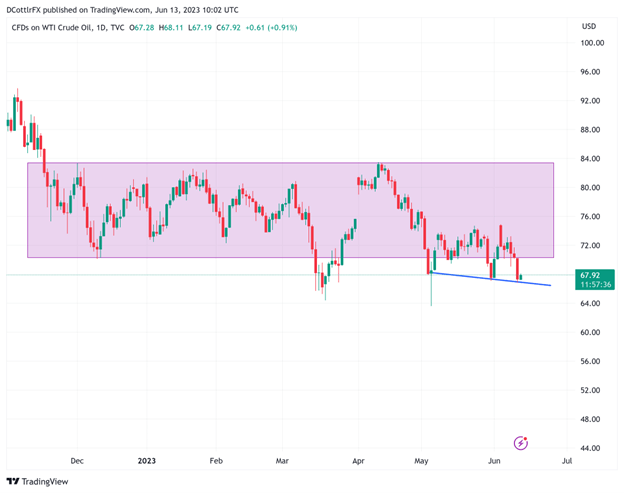
Chart Compiled Using TradingView
Daily-chart prices have once again fallen out of a broad trading band that the bulls may need to recover in short order if they’re going to avoid further, deeper falls. The band is bounded by the intraday-high of $83.28 hit on December 1 and retested again on April 13. The lower limit is December 9’s intraday low of $70.19.
The latest move lower has so far stuck to a modestly downward-sloping trend line which offers support very close to the current market at $66.83. A fall below that point on a daily or weekly closing basis might see further falls toward the recent significant low of $64.46 hit on March 20 and the lowest point seen since the end of 2021.
Still, the market is likely to be nervy at least until it knows what the Fed will do, and there’s another day to wait until it does.
| Change in | Longs | Shorts | OI |
| Daily | -4% | 7% | -2% |
| Weekly | -5% | -8% | -6% |
IGs’ own sentiment data finds investors incredibly bearish, with fully 92% expecting prices to fall further. This is by far the most bearish call on any widely-traded asset and in itself may well suggest that the pessimism is now a little overdone.
--By David Cottle for DailyFX


