


Crude Oil, WTI, US Jobless Claims, Technical Analysis- Talking Points:
- Crude oil prices fell on Wednesday after softer Fed energy report
- An unexpected surge in US jobless claims remains a threat to WTI
- Meanwhile, the 4-hour chart reveals a Bear Flag that is brewing

WTI crude oil prices fell about 1% on Wednesday, although the commodity is on course to rise about 5% this week. Broadly speaking, sentiment-linked oil diverged from what was a broader improvement in risk appetite. On Wall Street, the tech-heavy Nasdaq 100 rallied 1.8%, closing at the highest since the end of August. The index is now in a bull market, up 20% from the most recent bottom.
So why then did crude oil diverge from the ‘risk-on’ dynamic? A key culprit seemed to be an energy report by the Federal Reserve Bank of Dallas. Oil executives were surveyed by the central bank and they expect the price of oil to reach USD80 per barrel by the end of this year. That would represent a deterioration from the prior survey, which called for about USD84 per barrel.
Still, it could have been worse for WTI. The latest inventory report by the EIA showed that stockpiles last week unexpectedly contracted by about 7.5 million barrels. Economists were looking at roughly a +610k increase. This unexpected decrease in supply worked to cushion the bearish effect of the energy report from the Dallas Fed.
Looking ahead, traders will be closely watching the next US jobless claims report, due at 12:30 GMT. Filings are expected to rise by 195k last week versus 191k prior. This data is some of the timeliest information we have on the labor market. The reason why this is important is that we will get a better idea of how the economy is faring in the wake of Silicon Valley Bank’s collapse. An unexpected surge could induce recession woes, which may end up denting WTI further.
Crude Oil Technical Analysis – 4-Hour Chart
WTI appears to be carving out a Bear Flag chart formation on the 4-hour setting below. The latest test of the ceiling could see prices aim toward the floor. Subsequent downside follow-through could open the door to extending losses seen through the middle of March. Otherwise, key resistance seems to be at 74.32. Clearing this point exposes the March peak at 80.90.
Trade Smarter - Sign up for the DailyFX Newsletter
Receive timely and compelling market commentary from the DailyFX team
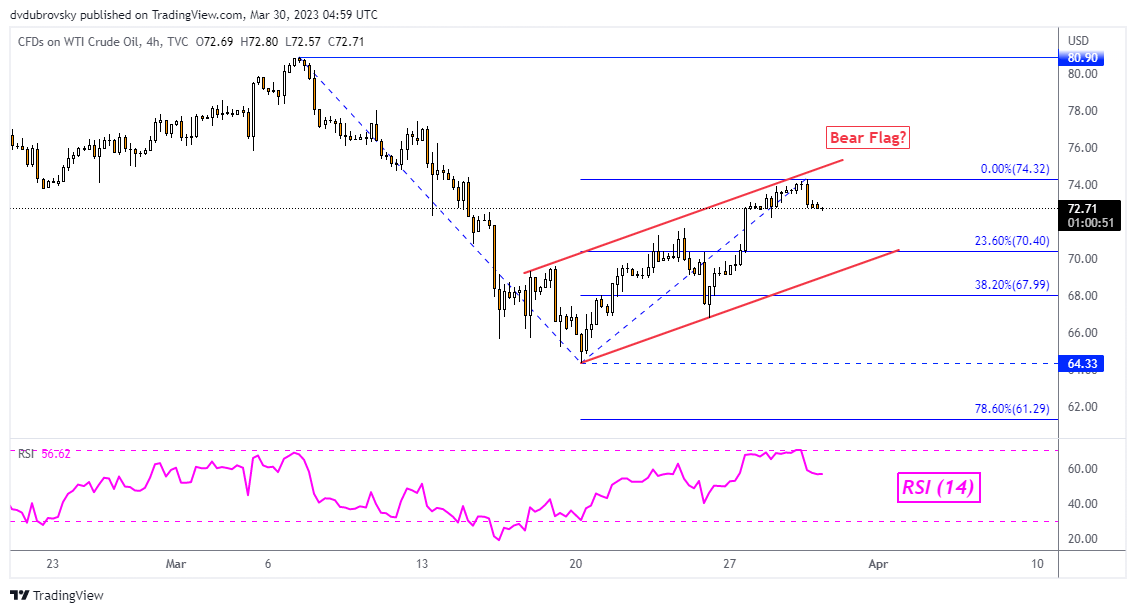
Chart Created Using TradingView
--- Written by Daniel Dubrovsky, Senior Strategist for DailyFX.com
To contact Daniel, follow him on Twitter:@ddubrovskyFX


