


Crude Oil, WTI, Brent, Federal Reserve, DXY Index, China, PBOC, EIA, API – Talking Points
- Crude oil faces some challenges with China’s outlook in focus
- Higher Treasury yields and the China situation might be related
- The PBOC is poised to ease policy today. Will that boost WTI?
Trade Smarter - Sign up for the DailyFX Newsletter
Receive timely and compelling market commentary from the DailyFX team
The crude oil price eased then rallied to start Monday after posting its first weekly loss since mid-June last week.
US Dollar strength across the board has been a feature of recent broader market price action and the commodity space has not been spared the calamity.
The WTI futures contract is near US$ 82 bbl while the Brent contract is approaching US$ 8.550 bbl at the time of going to print.
The Fed appears to be open to another potential hike in its target rate but perhaps more importantly, the back end of the Treasury curve has seen a notable bump up in yields.
The benchmark 10-year bond traded at 4.328% last Thursday but eased slightly into the weekend. That peak was just a fraction below the 4.335% seen in October last year, which was the highest return on that note since 2007.
At the same time, the DXY (USD) index traded at its highest level since early June.

The surge in Treasury yields could be related to the deterioration in the Chinese Yuan. The recent data on Treasury holdings revealed that China were again sellers of the bonds through June.
They have sold every month this year, except for March, a month that saw the Yuan rally significantly. China holds over US$ 800 billion of US Government debt.
With the Yuan tumbling last week and the capital price of Treasury bonds falling to lift yields, official selling from China could be a feature of the market as they seek to have US Dollars at the ready to be able to buy Yuan.
The outlook for China’s economy has been undermined by several defaults by large property players and more recently, a notable trust company missed its obligations last week.
The world’s second-largest economy is facing scrutiny on its ability to reignite growth, and this may have helped to hinder prospects there.
A Bloomberg survey of economists was anticipating the People’s Bank of China (PBOC) to ease monetary policy today by 15 basis points (bp) for the 1- and 5-year loan prime rate. They ended up moving the 1-year rate by only 10 bp to 3.45% and kept the 5-year rate unchanged at 4.20%.
Hong Kong's Hang Seng Index slipped lower on the news but crude caught a bid.
Looking ahead for oil, inventory reports from the American Petroleum Institute (API) and US Energy Information Agency (EIA) will be closely watched this week for clues on the tightness of the crude market.
Both measures have seen notable declines of late but with the price slipping, a build-up of stockpiles might be possible.
For more information on how to trade oil, click on the banner below.

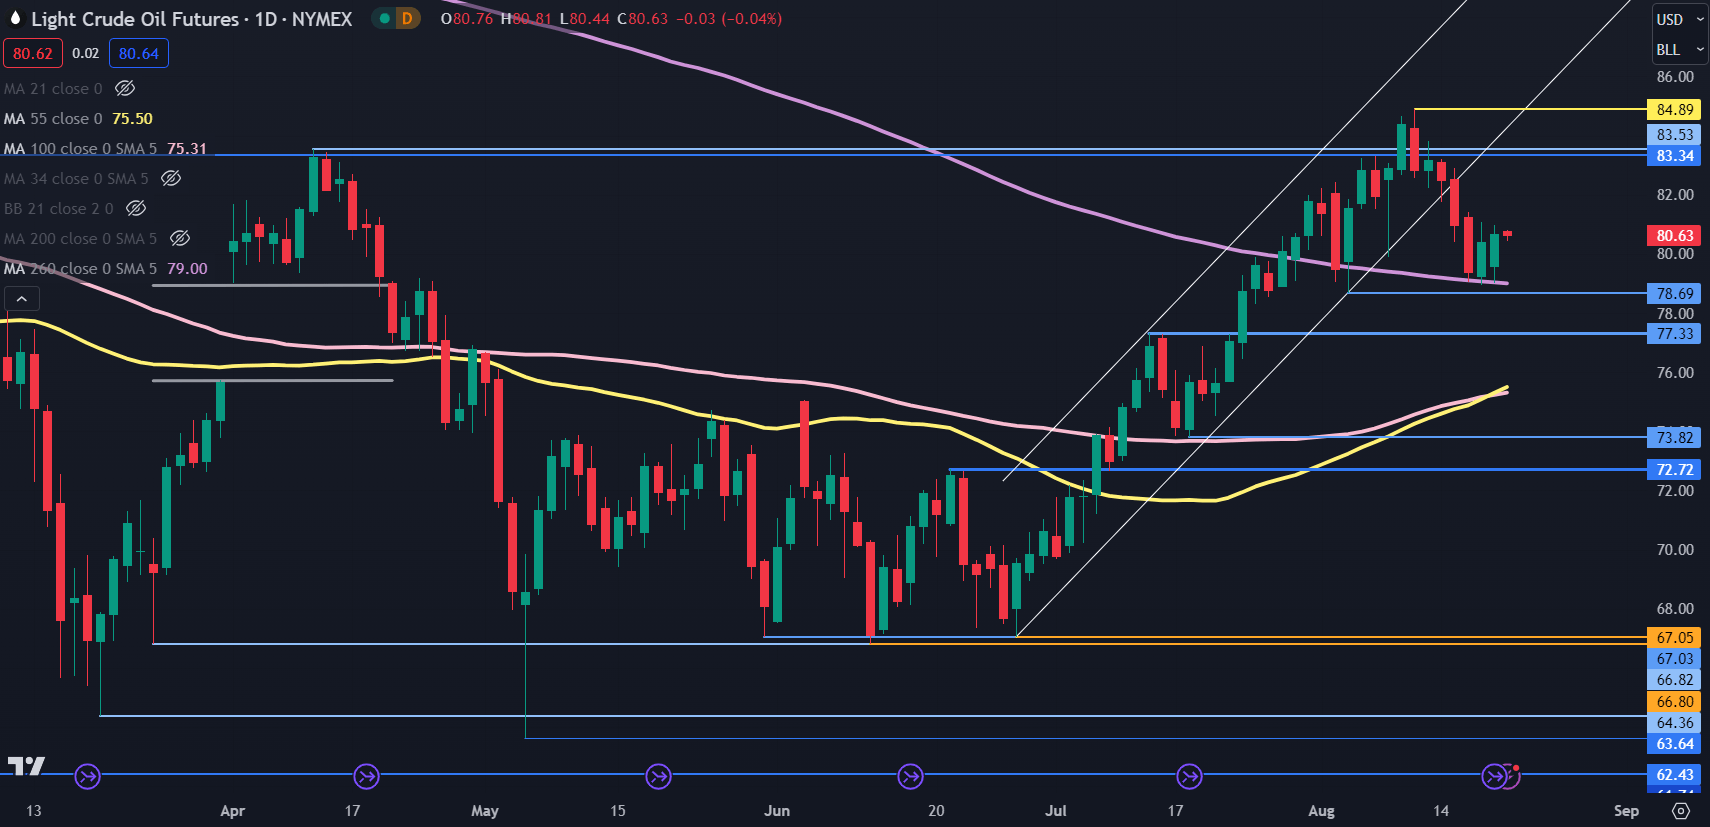
WTI CRUDE OIL TECHNICAL ANALYSIS SNAPSHOT
The WTI futures contract broke below the lower bound of an ascending trend channel last week and then found support near a prior low and the 260-day simple moving average (SMA).
Those levels might continue to provide support near 78.70 and 79.00.
Further down, support could be at the breakpoint of 77.33 and the prior low at 73.82. Between those levels, the 55- and 100-day SMAs may provide support in the 75.30 – 75.50 area.
On the topside, resistance might be at the breakpoints near 83.40 ahead of the recent peak at 84.89.
--- Written by Daniel McCarthy, Strategist for DailyFX.com
Please contact Daniel via @DanMcCarthyFX on Twitter


