


Copper News and Analysis
- Chinese demand slows and US, EU growth figures are due this week (Q1)
- Copper prices plummet through prior support as global growth concerns pick up
- The analysis in this article makes use of chart patterns and key support and resistance levels. For more information visit our comprehensive education library

Chinese Demand Slows and US, EU GDP Figures are Due This Week
The outlook for copper turned extremely bullish in December as China’s Zero-Covid policy came to an end along with the stringent lockdown. The opening of the Chinese economy since then has produced rather mixed results. Chinese GDP and local consumption have risen notably while the manufacturing sector, via the latest PMI data, appears to be stalling.
Chinese Manufacturing PMI (March)
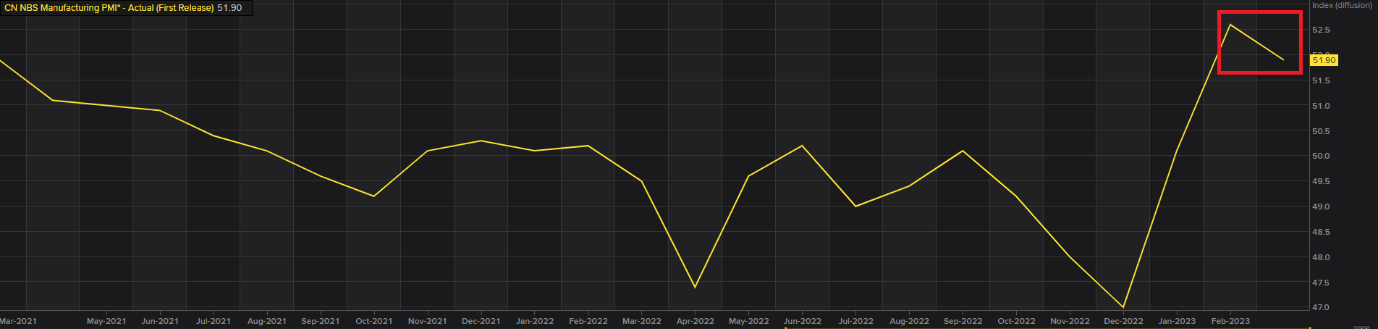
Source: Refinitiv, prepared by Richard Snow
Alongside the relative drop in the manufacturing sector, Chinese demand for copper has waned recently, which poses questions around the pace of the Chinese expansion. Analysts had suggested the Chinese government would set their sights on GDP growth in 2023 in the region of 5.5% to 6.5% and were subsequently taken by surprise when a more conservative figure of, “around 5%” was communicated.
Further signs of a rocky recovery appear when looking at the MSCI China Index which covers more than 80% of Chinese stocks or the broader SSE Composite Index - which has declined more than 4.5% in the last 5 trading sessions.
SSE Composite Index Daily Chart
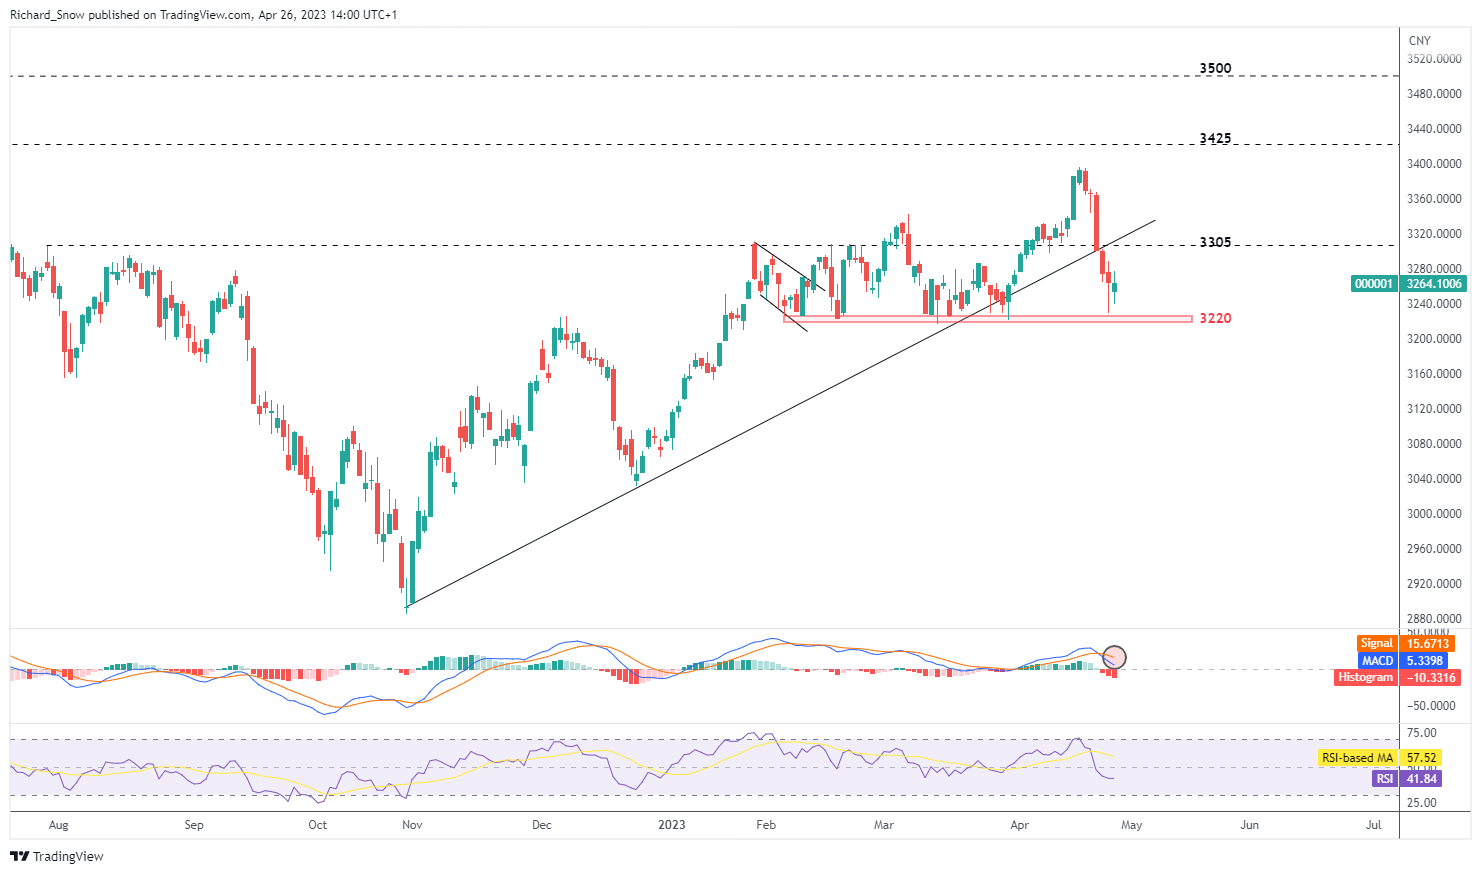
Source: TradingView, prepared by Richard Snow
Leading Indicator of Economic Health Sends a Warning to Markets
Due to copper’s largescale use in items in our homes, cars, electronics, factories, and power generation, it is often looked to as a leading indicator of economic growth. When the economy expands, more of the above items are produced/manufactured and in a contraction, production of the same goods declines.
That is why a lot is being said about the latest decline in copper prices ahead of Q1 GDP figures in the US and EU – two very significant economies. Not only that, but the Fed in their March meeting also expressed that their base case is now for the US to enter into a recession in 2023, which does not bode well for the industrial metal.
Copper prices dropped ever since the touch of the descending trendline, acting as resistance, and has sold off in each of the last 5 sessions with yesterday’s decline the largest. Prices now test the 8595 level, this time as resistance with the next significant level of resistance back up at the 8595 zone. To the downside, the next level of support appears at 8442 followed by 8188. The RSI approaches oversold levels but has yet to breach it, meaning further downside remains possible.
Copper Daily Chart
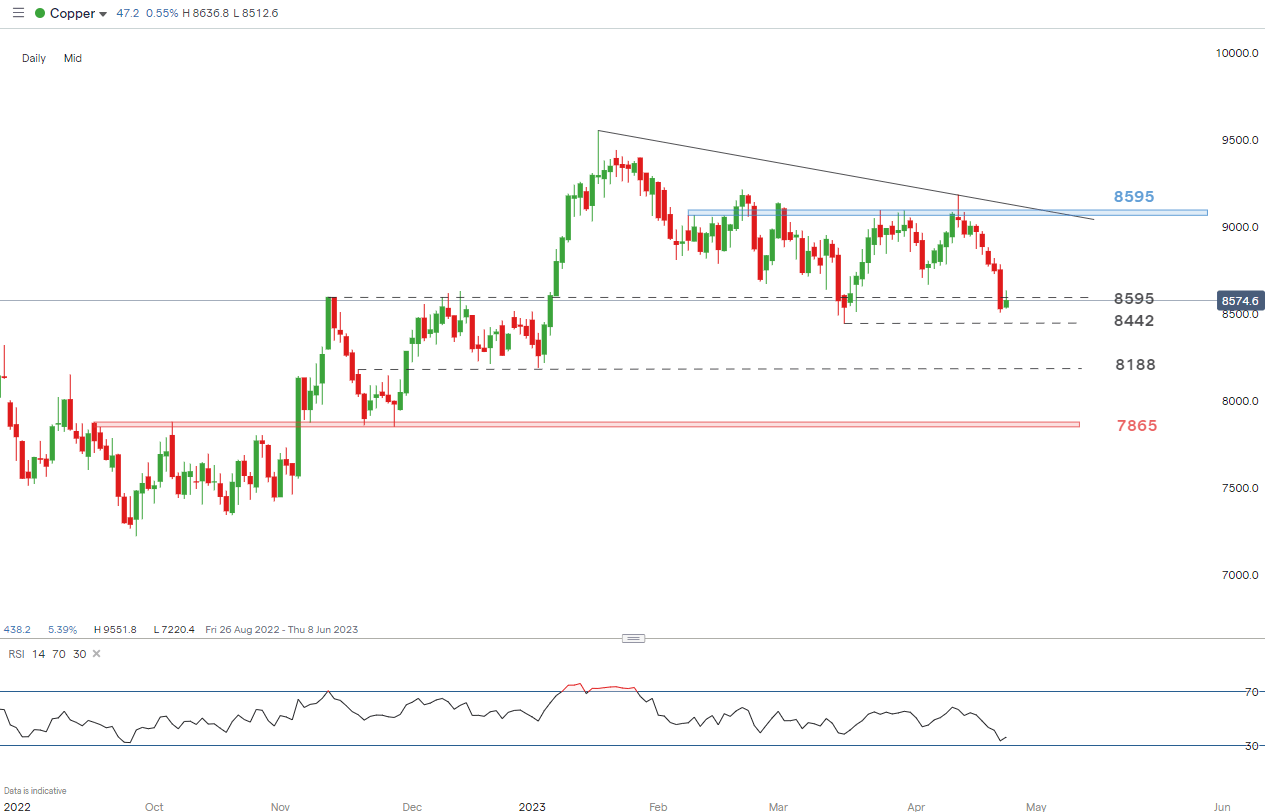
Source: IG, prepared by Richard Snow
Trade Smarter - Sign up for the DailyFX Newsletter
Receive timely and compelling market commentary from the DailyFX team
--- Written by Richard Snow for DailyFX.com
Contact and follow Richard on Twitter: @RichardSnowFX


