


British Pound: GBP/USD Charts and Analysis
- US rate expectations now point to a 25bp rate cut in May and a total of 125bps in 2024.
- US GDP and inflation data will be the key drivers of short-term momentum.

For all market-moving economic data and events, see the DailyFX Calendar
Most Read: British Pound Latest: GBP/USD Remains Supported, BoE Warn on Inflation
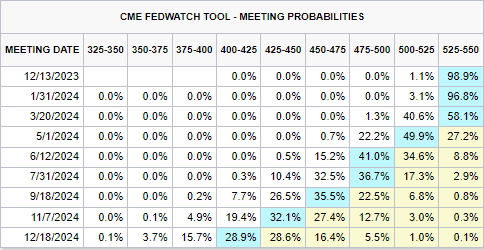
Interest rate cuts in the US may start in May next year with a total of five 25bp cuts now priced in for 2024, according to the latest CME market probabilities. There is a growing perception that US growth is set to slow over the coming months, and that coupled with inflation slowing down will allow the Fed to act faster than originally thought. This week we have the second look at US GDP and the latest US inflation report and these will steer markets in the coming days.
CME FedFund Expectations
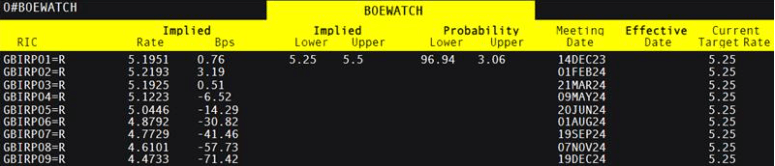
UK rate expectations in contrast show the first 25bp rate cut fully priced in for the August meeting with a total of 71 basis points seen trimmed off the Bank Rate over the year. Recent commentary coming out of the Bank of England has warned that UK inflation may remain above target for longer than previously thought, dampening expectations of an H1 2024 rate.
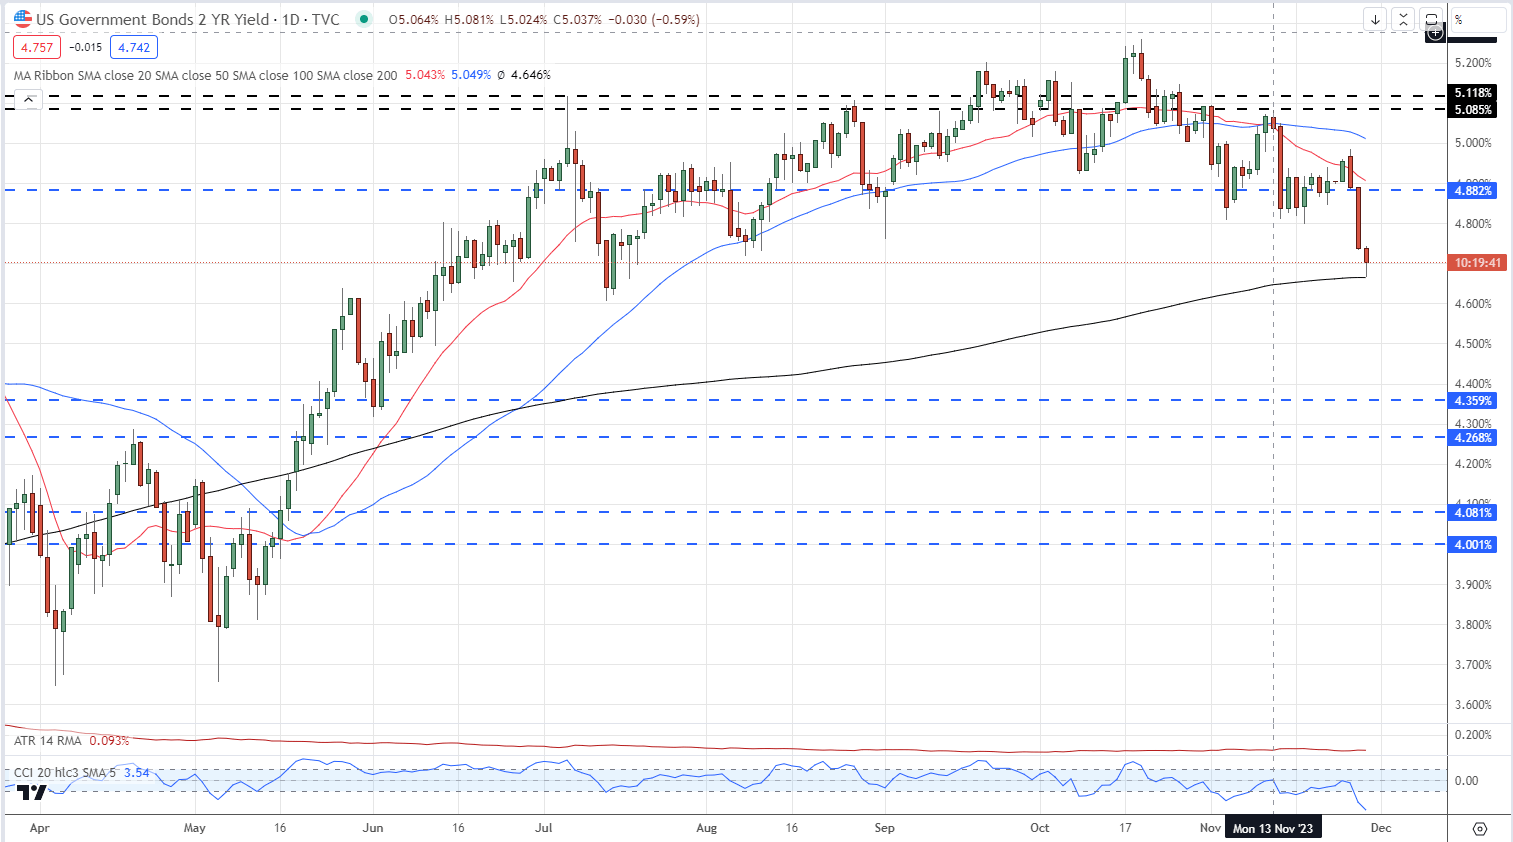
The yield on the rate sensitive US 2-year has fallen sharply this week as rate cut expectations grow, and is now at levels last seen back in July. From a technical outlook, the yield has bounced off the 200-day simple moving average, and this needs to hold to prevent the yield from falling further. This weakness is pulling the US dollar lower.
US 2-Year Yield Daily Chart
With Sterling grabbing a small bid, and the US dollar under pressure, cable has been posting a batch of fresh multi-week highs over the past couple of weeks. The pair tested and then broke through the 200-day sma last week and this coincided with a break above the 50% Fibonacci retracement level. The pair now rest between two prior levels of interest, 1.2667 and 1.2742.
GBP/USD Daily Price Chart
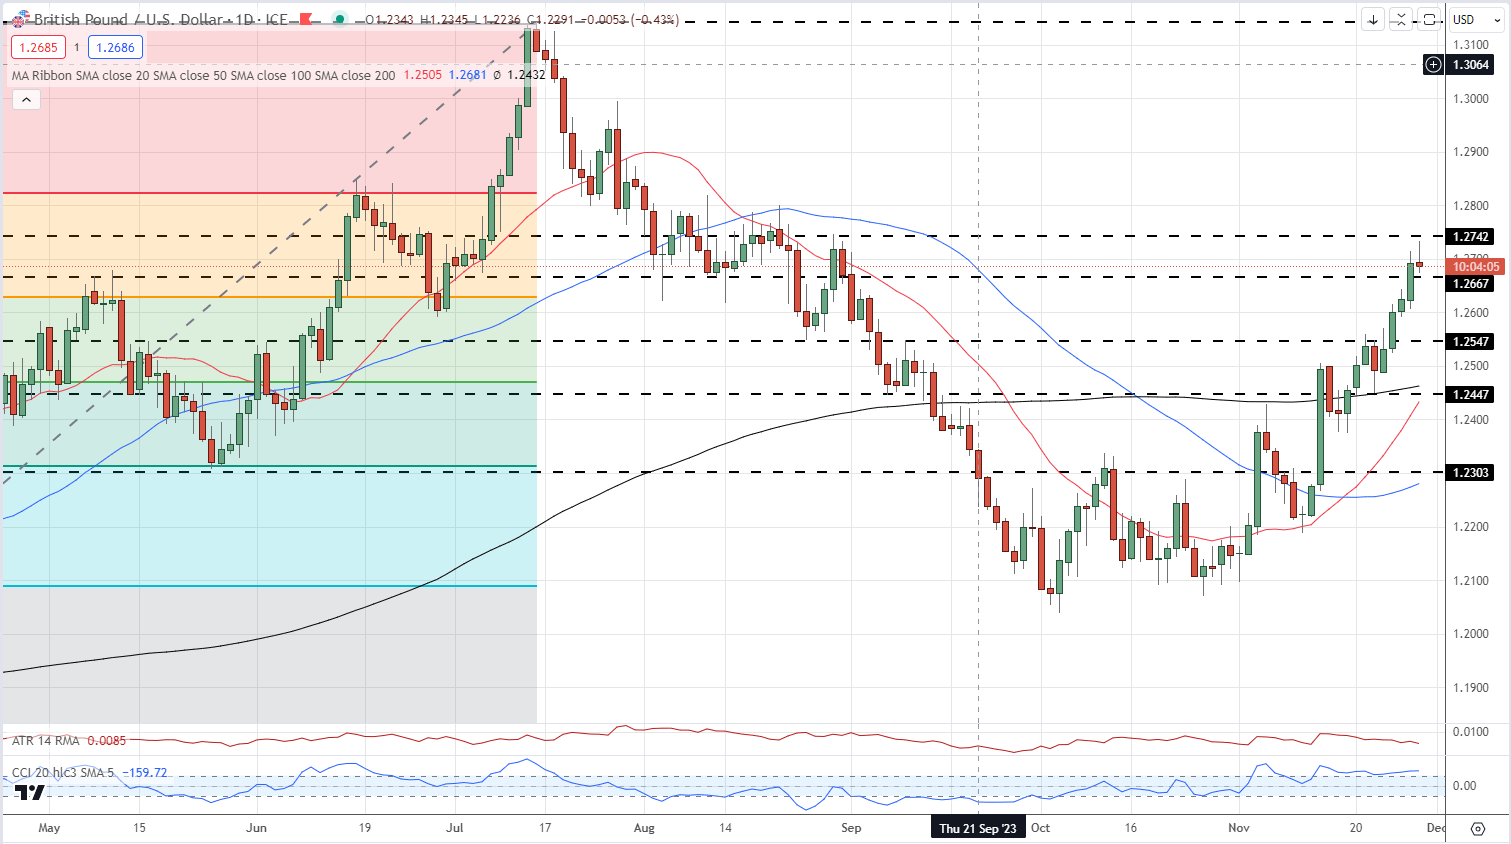
Charts using TradingView
Retail trader data show 40.34% of traders are net-long with the ratio of traders short to long at 1.48 to 1.The number of traders net-long is 13.16% lower than yesterday and 19.65% lower than last week, while the number of traders net-short is 2.12% higher than yesterday and 14.66% higher than last week.
What Does Changing Retail Sentiment Mean for Price Action?
| Change in | Longs | Shorts | OI |
| Daily | -5% | -15% | -10% |
| Weekly | -10% | 3% | -5% |
What is your view on the British Pound – bullish or bearish?? You can let us know via the form at the end of this piece or you can contact the author via Twitter @nickcawley1.


