
Bitcoin, BTC/USD, Ethereum, ETH/USD - Outlook:
- Bitcoin and Ethereum trends have diverged recently.
- BTC/USD needs to clear the July high for the upward trajectory to persist..
- What is the outlook and what are the key levels to watch?
Supercharge your trading prowess with an in-depth analysis of oil's outlook, offering insights from both fundamental and technical viewpoints. Claim your free Q4 trading guide now!

BITCOIN: Takes on vital resistance
Bitcoin continues to be well supported, now testing a formidable resistance on the 200-day moving average, roughly coinciding with the end-August high of 28150. This follows a hold last month above strong support at the June low of 24750, which has kept intact the higher-top-higher-bottom formation since the end of 2022. Importantly, this keeps alive the possibility of an extended recovery given the 2021-2022 decline and the possibility of Bitcoin shedding some of its underperformance Vs Ethereum in recent years.
BTC/USD Daily Chart
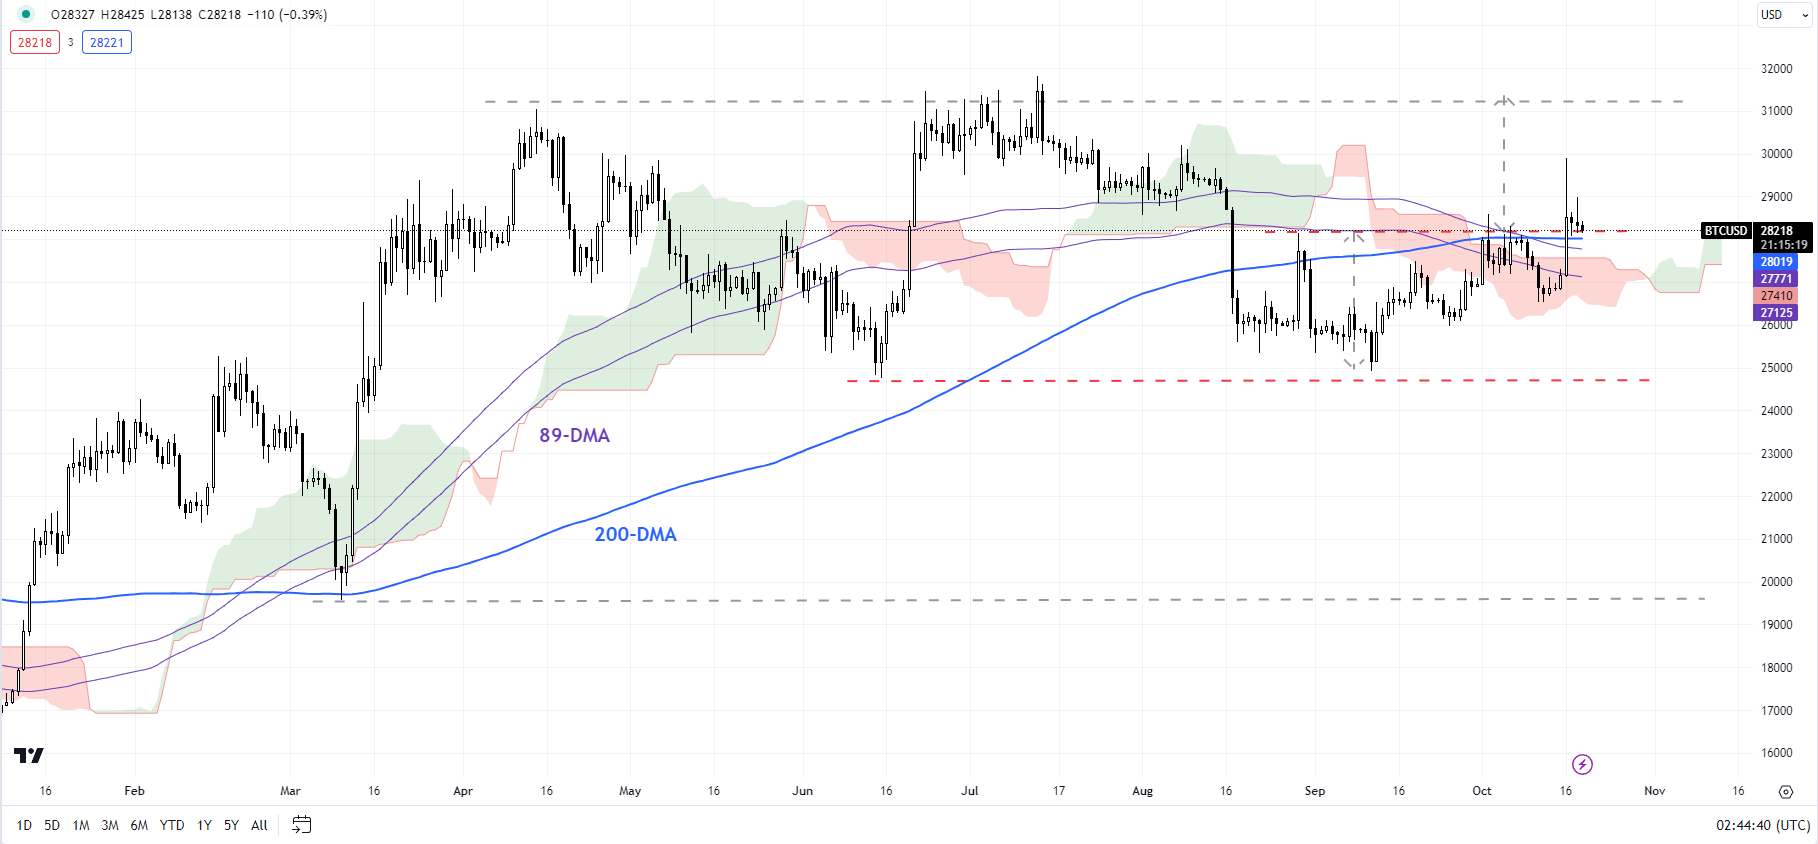
Chart Created by Manish Jaradi Using TradingView
Any decisive break above 28150 could clear the path toward the July high of 31800, which would be a significant resistance to crack. A cross-over would trigger a double bottom (the 2023 lows) and importantly reinforce the bullish medium-term trajectory, first highlighted earlier this year – see “Bitcoin Technical Outlook: BTC/USD Turns Bullish”, published January 18.
BTC/USD Vs ETH/USD Daily Chart
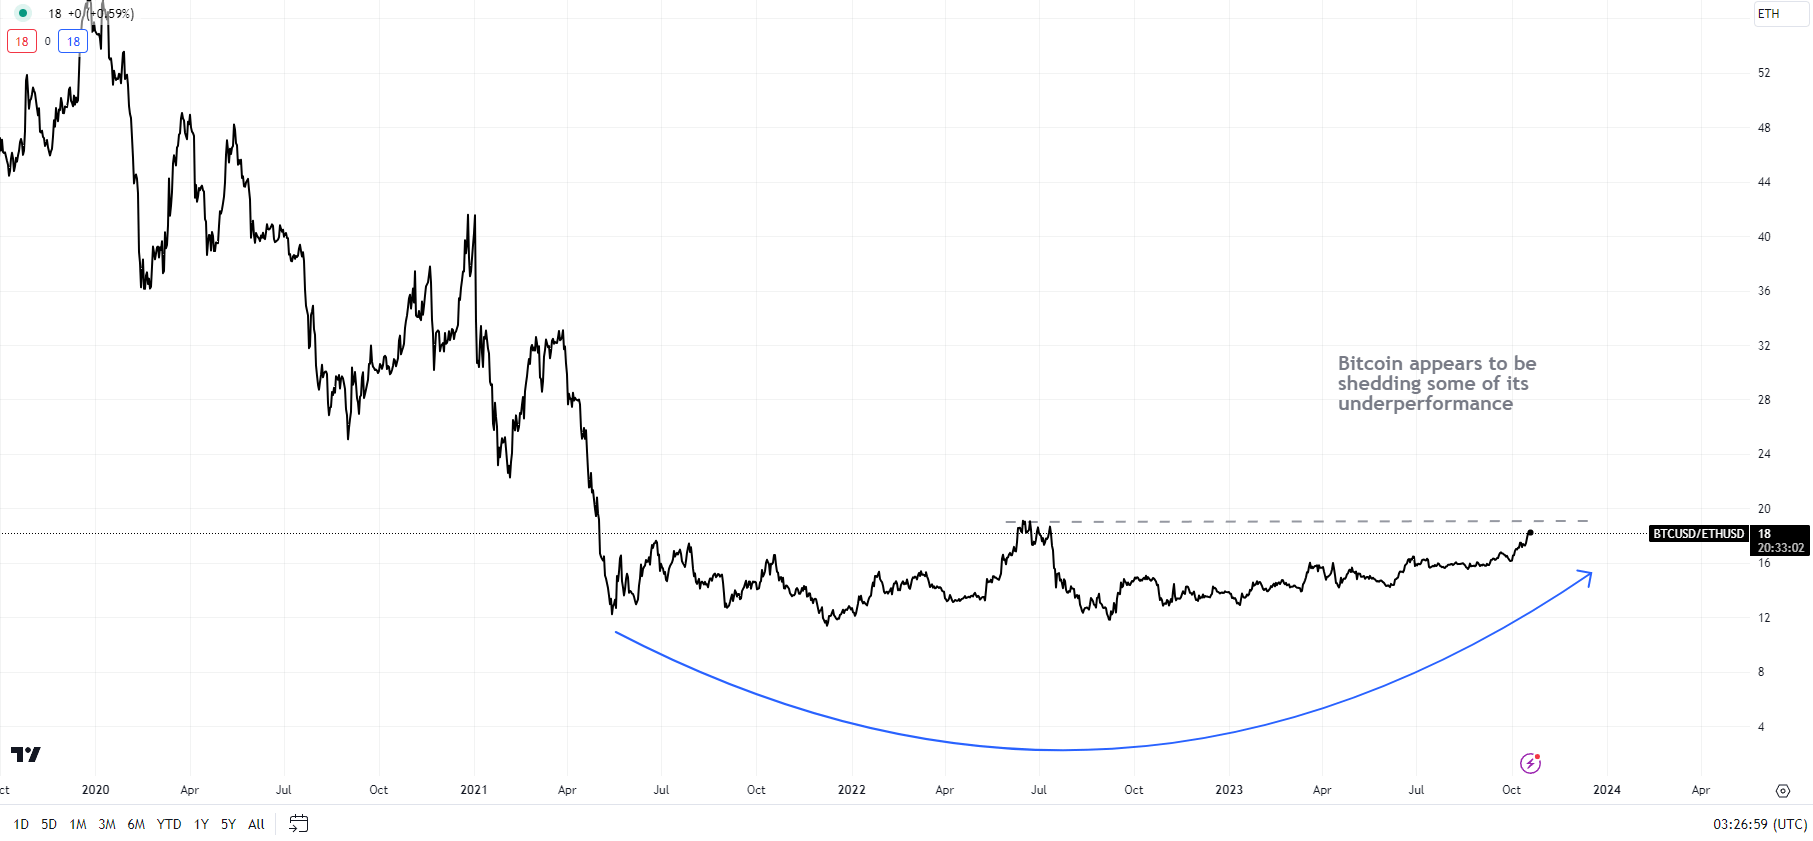
Chart Created by Manish Jaradi Using TradingView
The potential price objective of the double bottom pattern (the June and the September lows) works out to around 39000. Such a move would imply a break above the 89-week moving average and a cross above the upper edge of the Ichimoku cloud on the weekly charts – for the first time since 2022. For the bullish view to unfold, BTC/USD needs to stay above the June low of 24750.
-Curious to learn how market positioning can affect asset prices? Our sentiment guide holds the insights—download it now!

ETHEREUM: Beginning to look vulnerable
The lack of a meaningful upward momentum in recent weeks raises the risk of Ethereum staging a secondary/lower high on the weekly charts, relative to early 2023. This would be the first time since the recovery started in late 2022 that the higher-highs-higher-lows sequence would be broken. ETH/USD in August fell below crucial support on the 200-day moving average for the first time since January.
ETH/USD Weekly Chart
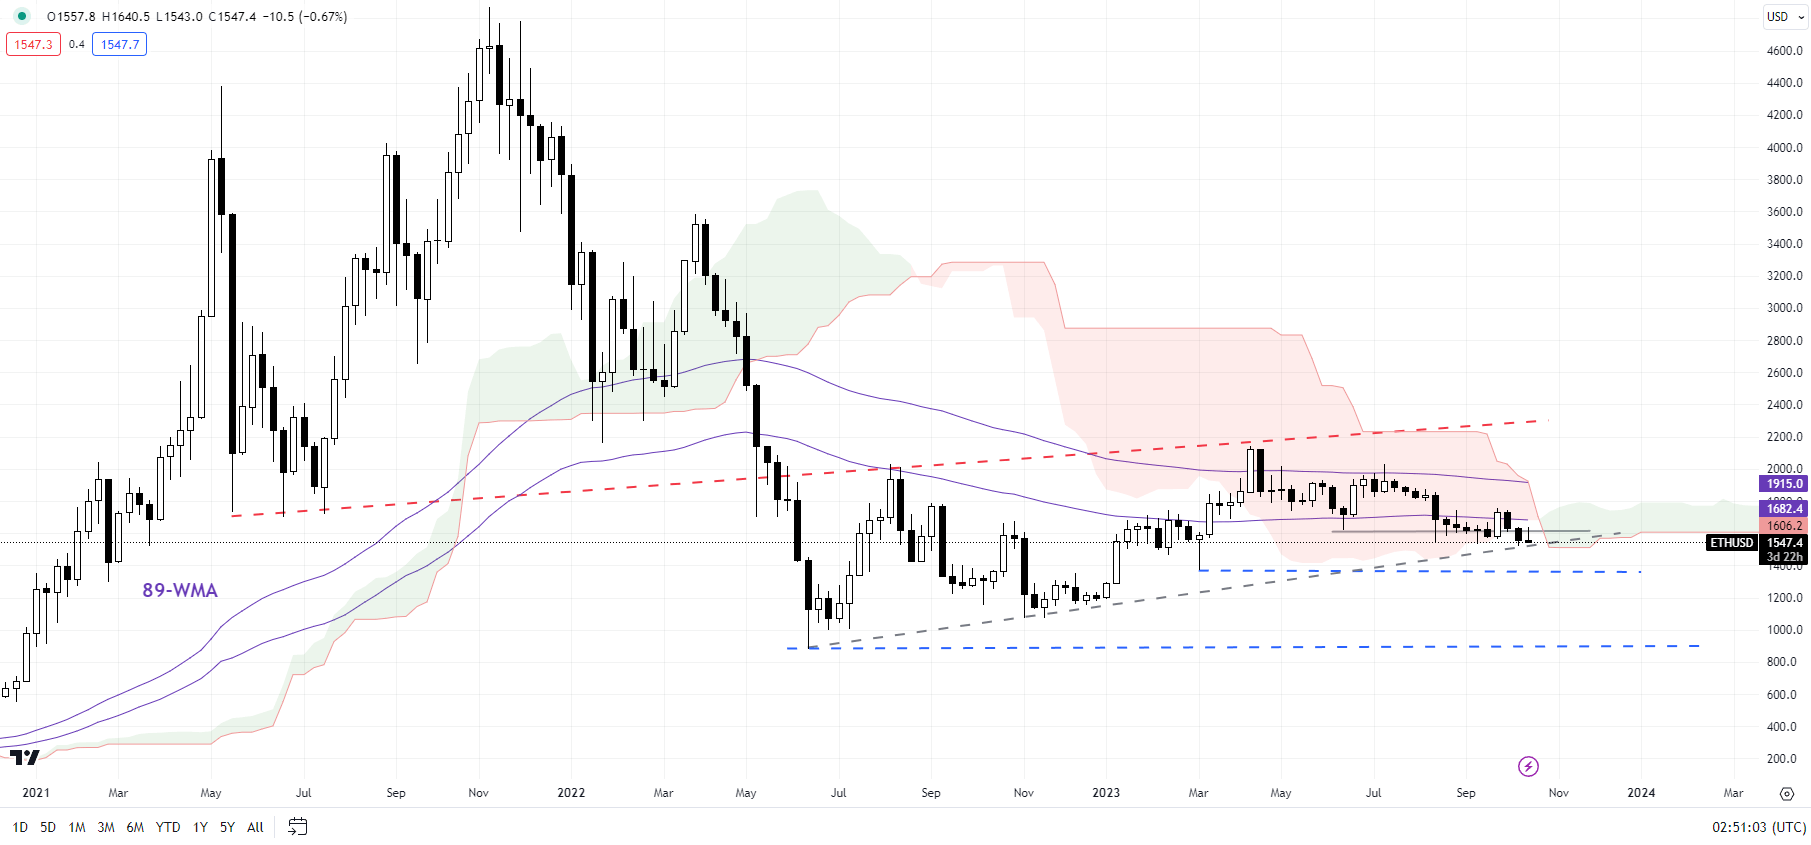
Chart Created by Manish Jaradi Using TradingView
As highlighted in the previous update, the retreat from key resistance on the 89-day moving average earlier this month coupled with the subsequent fall below the June low keeps the bearish bias intact. ETH/USD is now attempting to break below the key cushion at the August low of 1550. A decisive break below could initially pave the way toward the lower edge of a downtrend channel since April (now at about 1450), potentially the October low of 1370.
ETH/USD Daily Chart
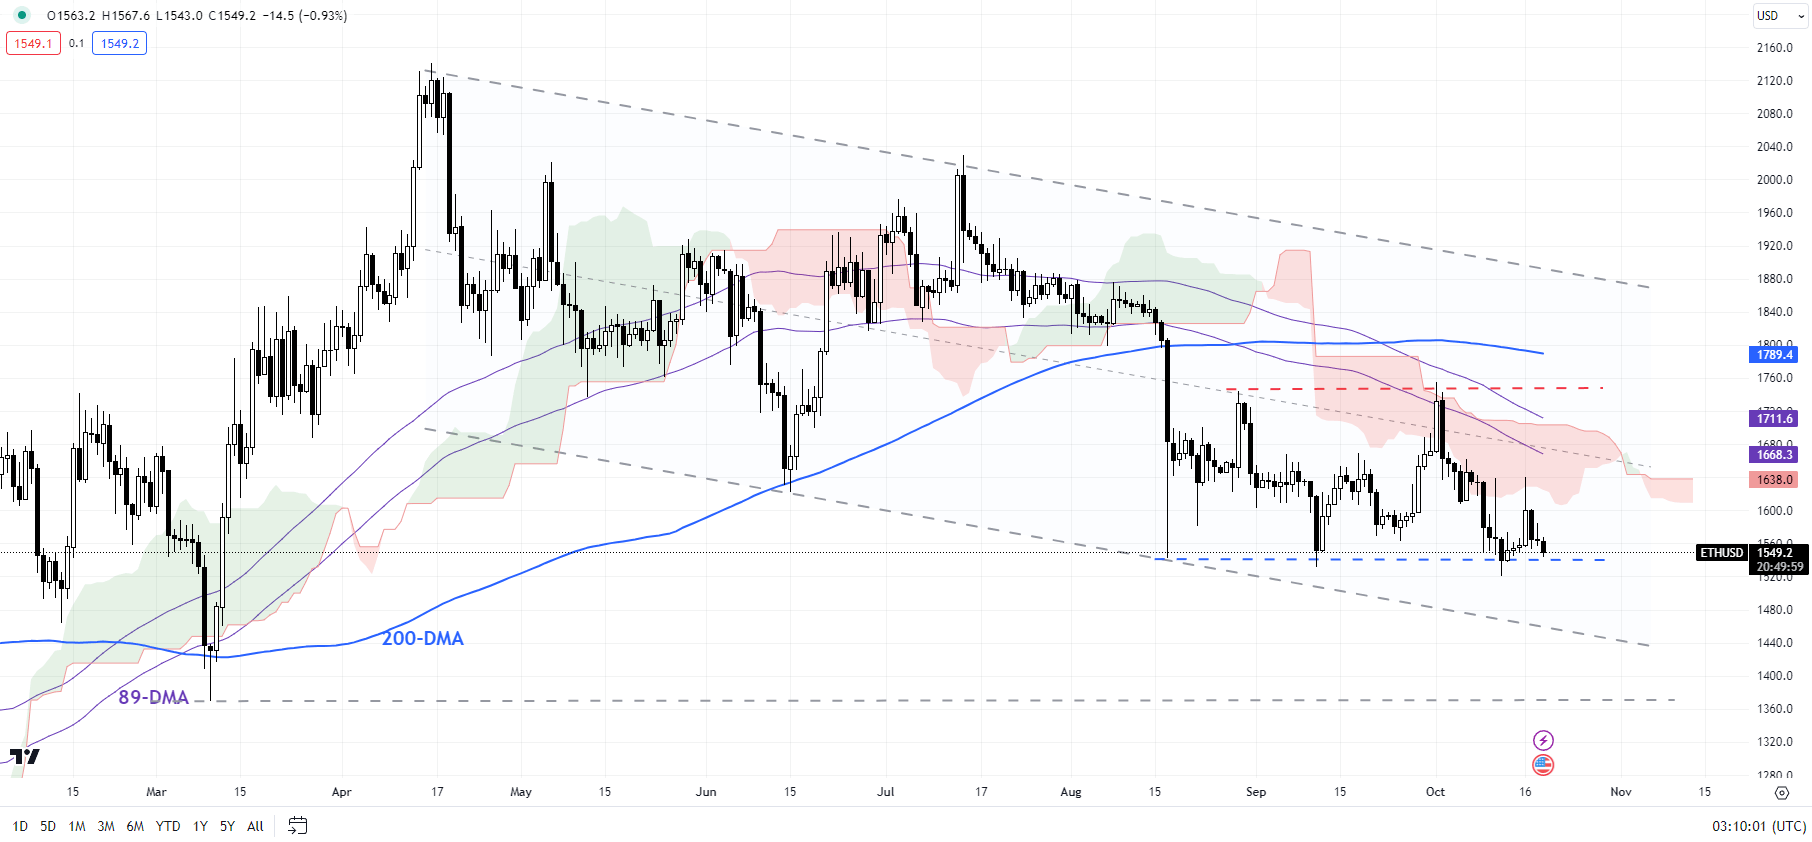
Chart Created by Manish Jaradi Using TradingView
On the weekly charts, ETH/USD has been under the influence of the bearish Ichimoku cloud cover and appears to be now succumbing to the cloud pressure. For the immediate downside risks to fade, Ethereum needs to surpass 1750, including the end of August and the early-October highs.
If you're puzzled by trading losses, why not take a step in the right direction? Download our guide, "Traits of Successful Traders," and gain valuable insights to steer clear of common pitfalls that can lead to costly errors.

--- Written by Manish Jaradi, Strategist for DailyFX.com
--- Contact and follow Jaradi on Twitter: @JaradiManish