


Markets Talking Points:
- Crude oil will start the week with a traditional breakout tapping into more significant themes than just a technical groundswell
- EURUSD is a prime candidate of frustrating range, but any progress it finds will be a strong barometer on global fundamental issues
- As risk appetite seems to stretch its legs once again, focus on leverage calls attention to the explosion of government debt
See how retail traders are positioning in US Crude Oil, EURUSD, FX majors, indices, commodities and cryptocurrency on an intraday basis using the DailyFX speculative positioning data on the sentiment page.
There are a range of impressive charts shaping up across the financial system. The S&P 500 and Dow are continuing their climb back towards the record highs set in October. Gold has rallied despite the positive sentiment lean and firm Dollar. And I made my case recently for USDCHF as a large wedge that still has considerable room for the Dollar to rally should it find an unexpected charge. Yet, as impressive as these pictures are, they are not my top three charts to watch moving forward.
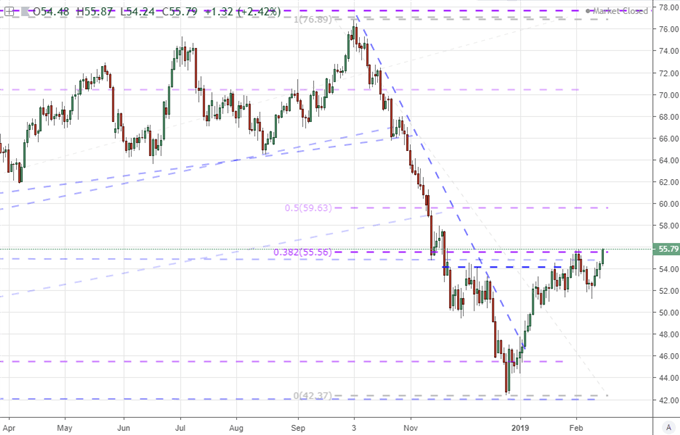
1 Crude Oil Sports a Head-and-Shoulders Break and Connect to Critical Themes
Perhaps one of the most technically-loaded charts among the markets I regularly keep track of comes from the benchmark US crude oil contract, WTI. It is difficult to miss the very large inverse head-and-shoulders pattern the commodity has carved out over the past few months. In such patterns, the lead in to the congestion is as important as the supposed reversal structure itself. Here, we have the incredible slide between October and December to reflect the wind up. Therefore, the break above the supposed 'neckline' that falls at the convergence of a multi-week trendline of highs and the 38.2% Fibonacci retracement of the aforementioned tumble is no small development. That said, there is a vast difference between a break and a trend. Follow through often requires more motivation than just a simple technical trigger, and therein rests the true success or failure of this move. It won't be headlines on production from OPEC or important non-OPEC members, nor US inventory updates that facilitate a trend of this scale. True risk appetite and the related conviction in global growth are the deep themes that would shrug off the restraints on this market.
Chart of US Oil (Daily)
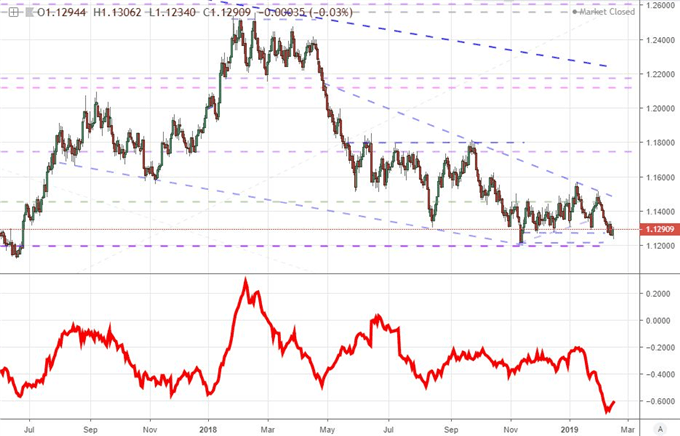
2 EURUSD's Range Signals More than Just Frustration for Trend-Starved Traders
The second chart on my list is the EURUSD's progress. Here, there is a very different perspective than what we see in crude. Whereas the commodity is on the cusp of a significant technical transition, this benchmark pair is still comfortably within its range. In fact, the 20-day ATR (Average True Range) on this pair has dropped to its lowest level since the Summer of 2014 - a period that haunts FX traders for how extreme it was. This restriction to a 1.1550 to 1.1200 span belies the laundry list of critical fundamental themes that are all converging on the pair. Relative monetary policy and rate forecasts is critical and unresolved. Risk trends are a related concern which does not find an overt return and haven currency in the pairing - despite a clear yield differential. Growth considerations, political unbalance and the risk of aggressive trade policy adoption (a trade war could be provoked between the US and Eurozone should auto tariffs be pursued) are all critically important yet lost in the deluge. This mix is so remarkable, that when it does clear; it must be developing under remarkable circumstances. In other words, if you want to know what critical fundamental theme is prevailing for the broader financial system, keep tabs on EURUSD.
Chart of EURUSD and the 20-day ATR (Daily)
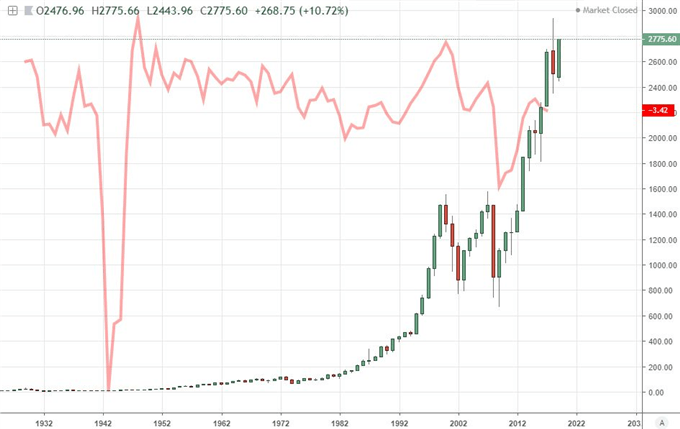
3 A Swell in US Federal Debt May Prove the Next 'Monetary Policy' or 'Trade War' Theme
This is where I may lose people looking for a quick turn or charge in a specific asset, but this chart's importance is far more significant for the long-term. The US is facing an unprecedented $22 trillion debt and a deficit that is expected to charge to levels that should make us more conscious of budgets. The US is projected to run a 4.6% deficit-to-GDP ratio this year - the highest in a non-recession year on record. This spending meant to amplify growth, but it has thus far done little to boost the restricted pace of a US economy that is conforming to wavering experienced across the globe. The real issue comes should capital markets start to implode and/or the economy stalls in spite of the government's support. Then what capacity is there to fight a serious problem? The same risk exists with the state of global monetary policy. There is great capacity for this otherwise 'boring' issue to fuel an unrelenting crisis. It could become as ubiquitous a fundamental talking point among investors as trade wars, monetary policy and financial leverage have been at different times over the past two decades.
Chart of the S&P 500 and US Federal Deficit as Ratio of GDP in Red (Annually)
If you want to download my Manic-Crisis calendar, you can find the updated file here.


