


Gold - XAU/USD Technical Analysis
Check our Q4 forecasts for EUR, USD, Oil and find out for free what might move the price this quarter.
Gold Price – Weak buyers & weaker Sellers
On Nov 26, Gold corrected downtrend move and created a higher low at $1,450. On Friday, the price closed the weekly candlestick with a Doji pattern highlighting the market’s indecision at this stage.
This week the Relative Strength Index (RSI) crossed above 50, then remained flat reflecting the end of downside move and the lack of enough momentum from buyers to lead the price.
Having trouble with your trading strategy? Here’s the #1 Mistake That Traders Make
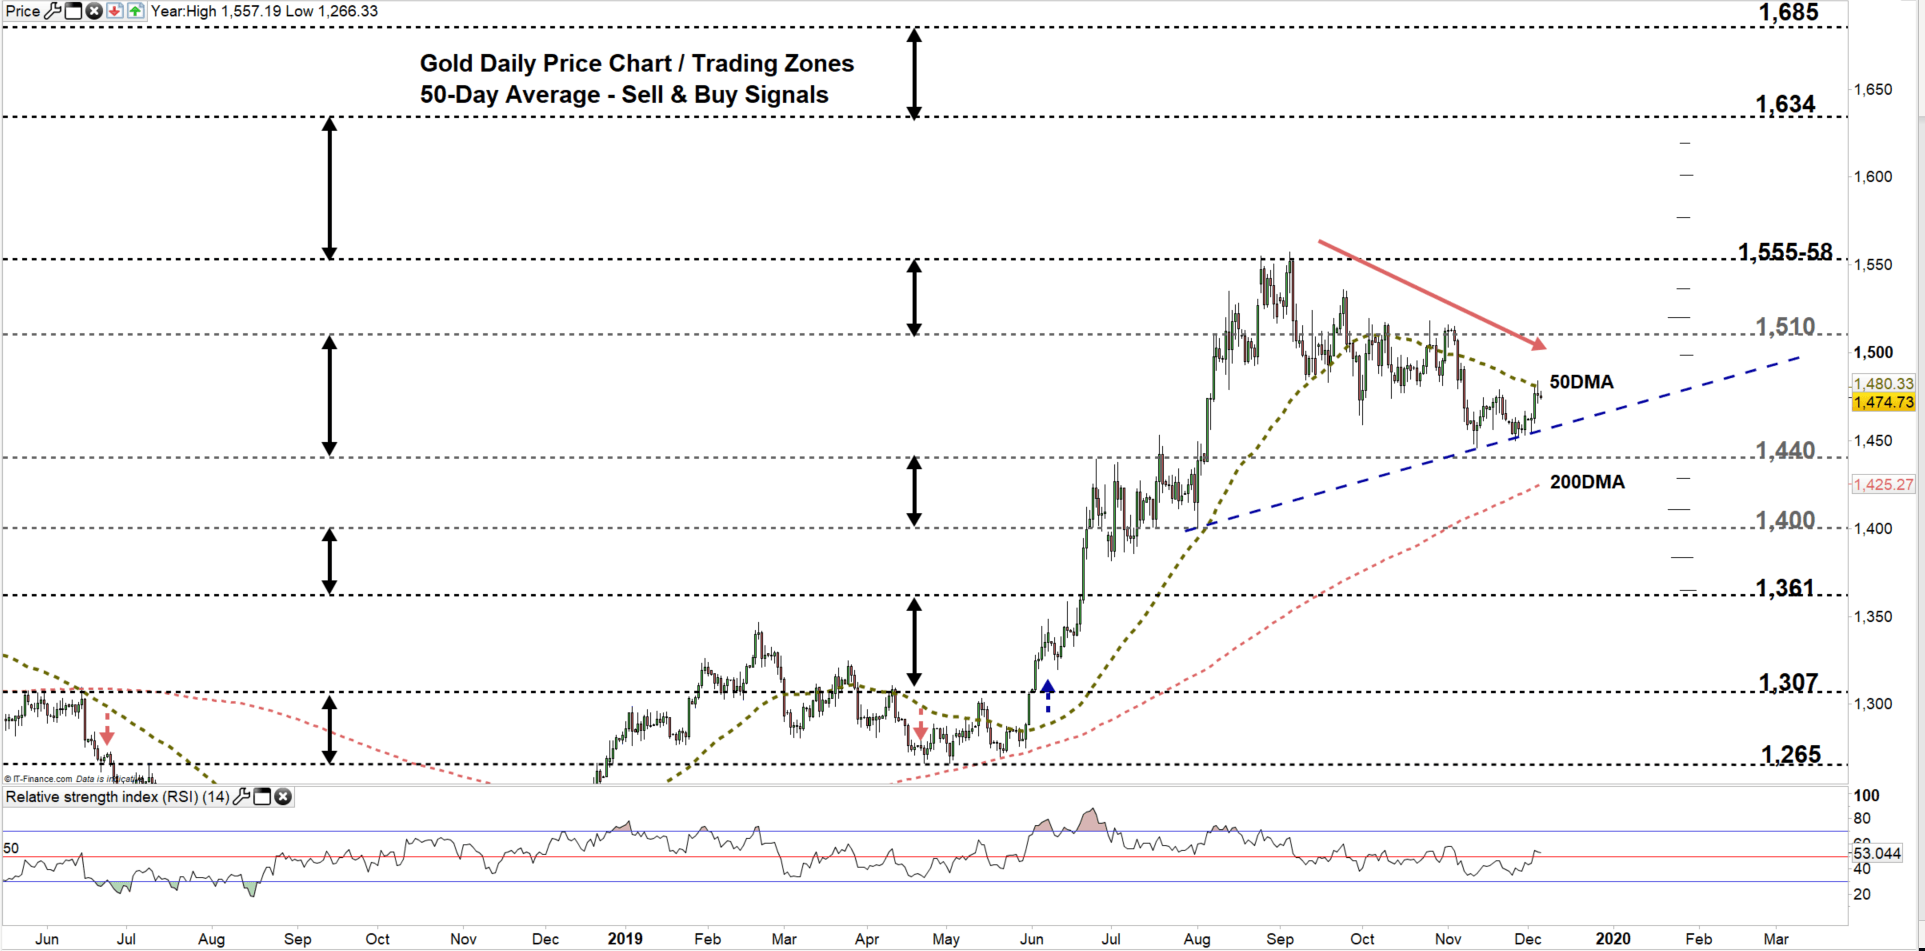
Gold DAILY PRICE CHART (MaY 31, 2018 – DEC 5, 2019) Zoomed out
Gold DAILY PRICE CHART (AUG 1 – DEC 5, 2019) Zoomed In
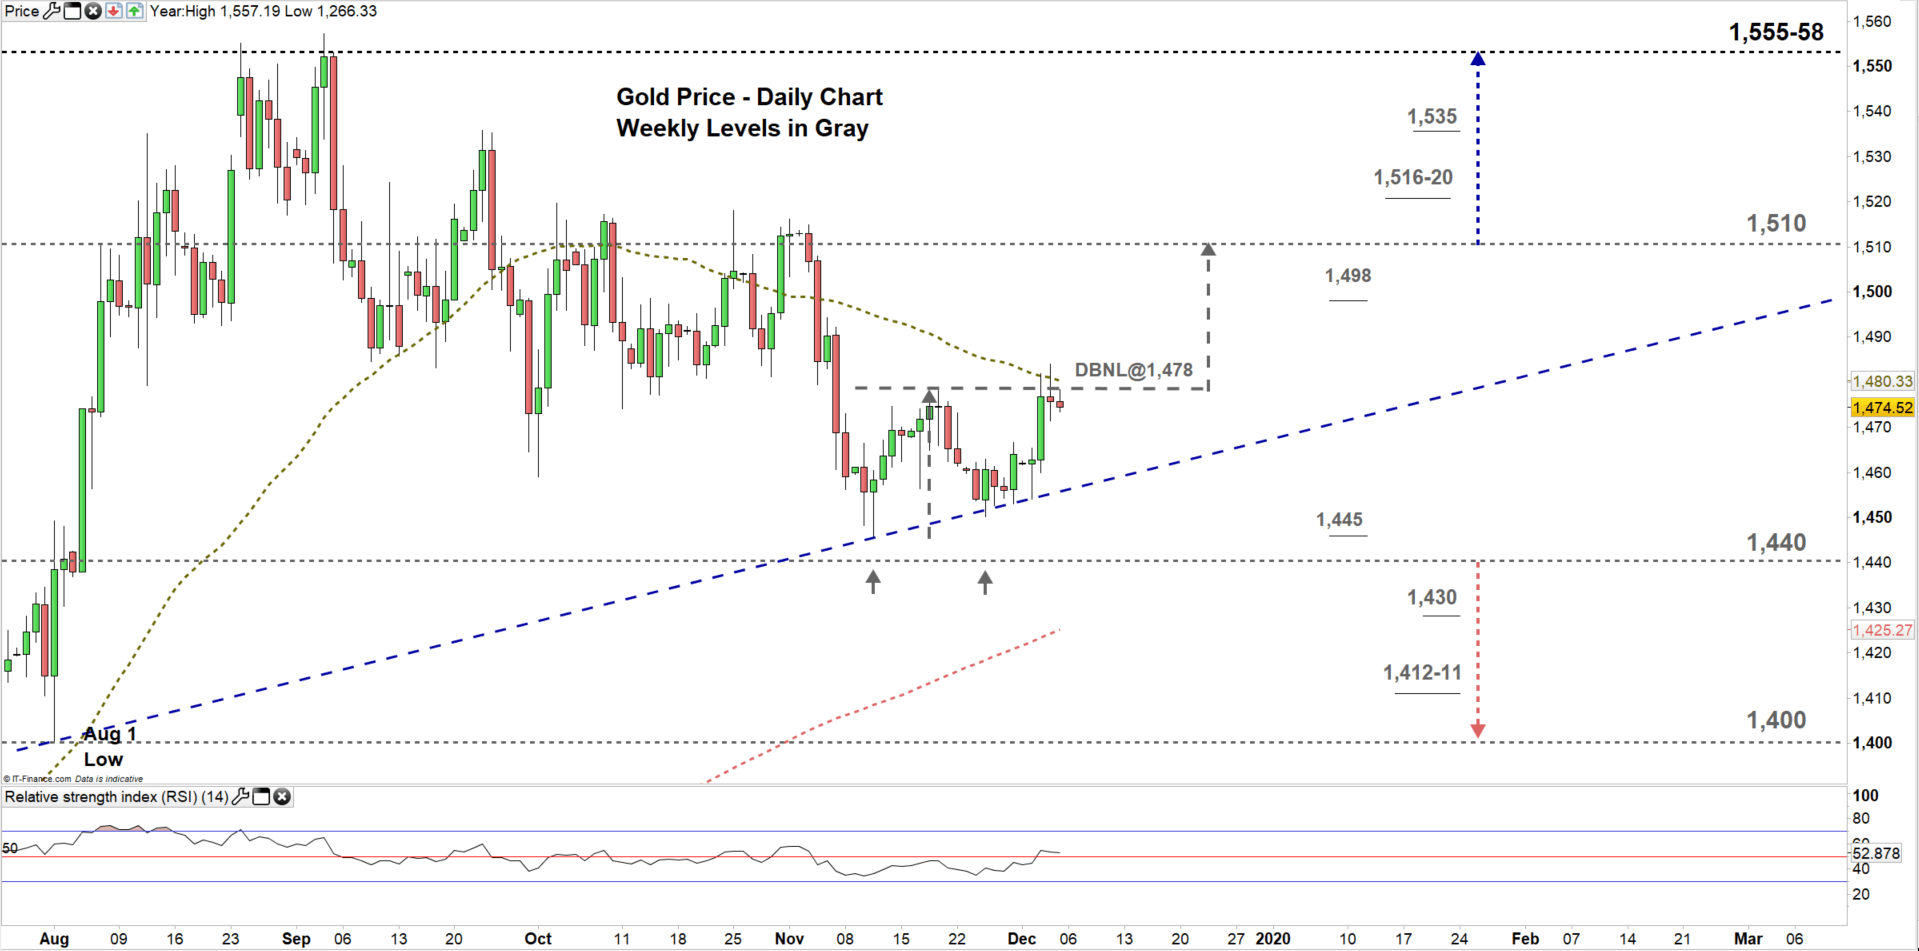
Looking at the daily chart, we notice the price is still moving in the trading zone entered in Nov 4 ($1,440- $1,510). Gold remained trading above the uptrend line originated from the Aug 1 low at $1,400 reflecting some sellers exiting the market. This led the precious metal to rally then test the neckline of double bottom pattern located at $1,478.
If Gold breaks and remains above the neckline, this could push the price towards the high end of current trading zone. A close above the high end could allow buyers to take the initiative and push towards the vicinity of $1,555-58. That said, this rally could weaken at the weekly resistance levels and area marked on the chart (zoomed in) as some buyers may take profit at these points.
It’s worth noting that, the price failed twice this week to overtake the 50-day average. This means buyer’s still hesitant at this stage. Sellers could peruse again pressing towards the low end of the zone. A successful close below the low end could embolden more market participants to send XAU/USD towards $1,400. Nevertheless, the weekly support levels underlined on the chart should be considered.
Just getting started? See our Beginners’ Guide for FX traders
Gold Four-HOUR PRICE CHART (Nov 3 – DEC 5, 2019)
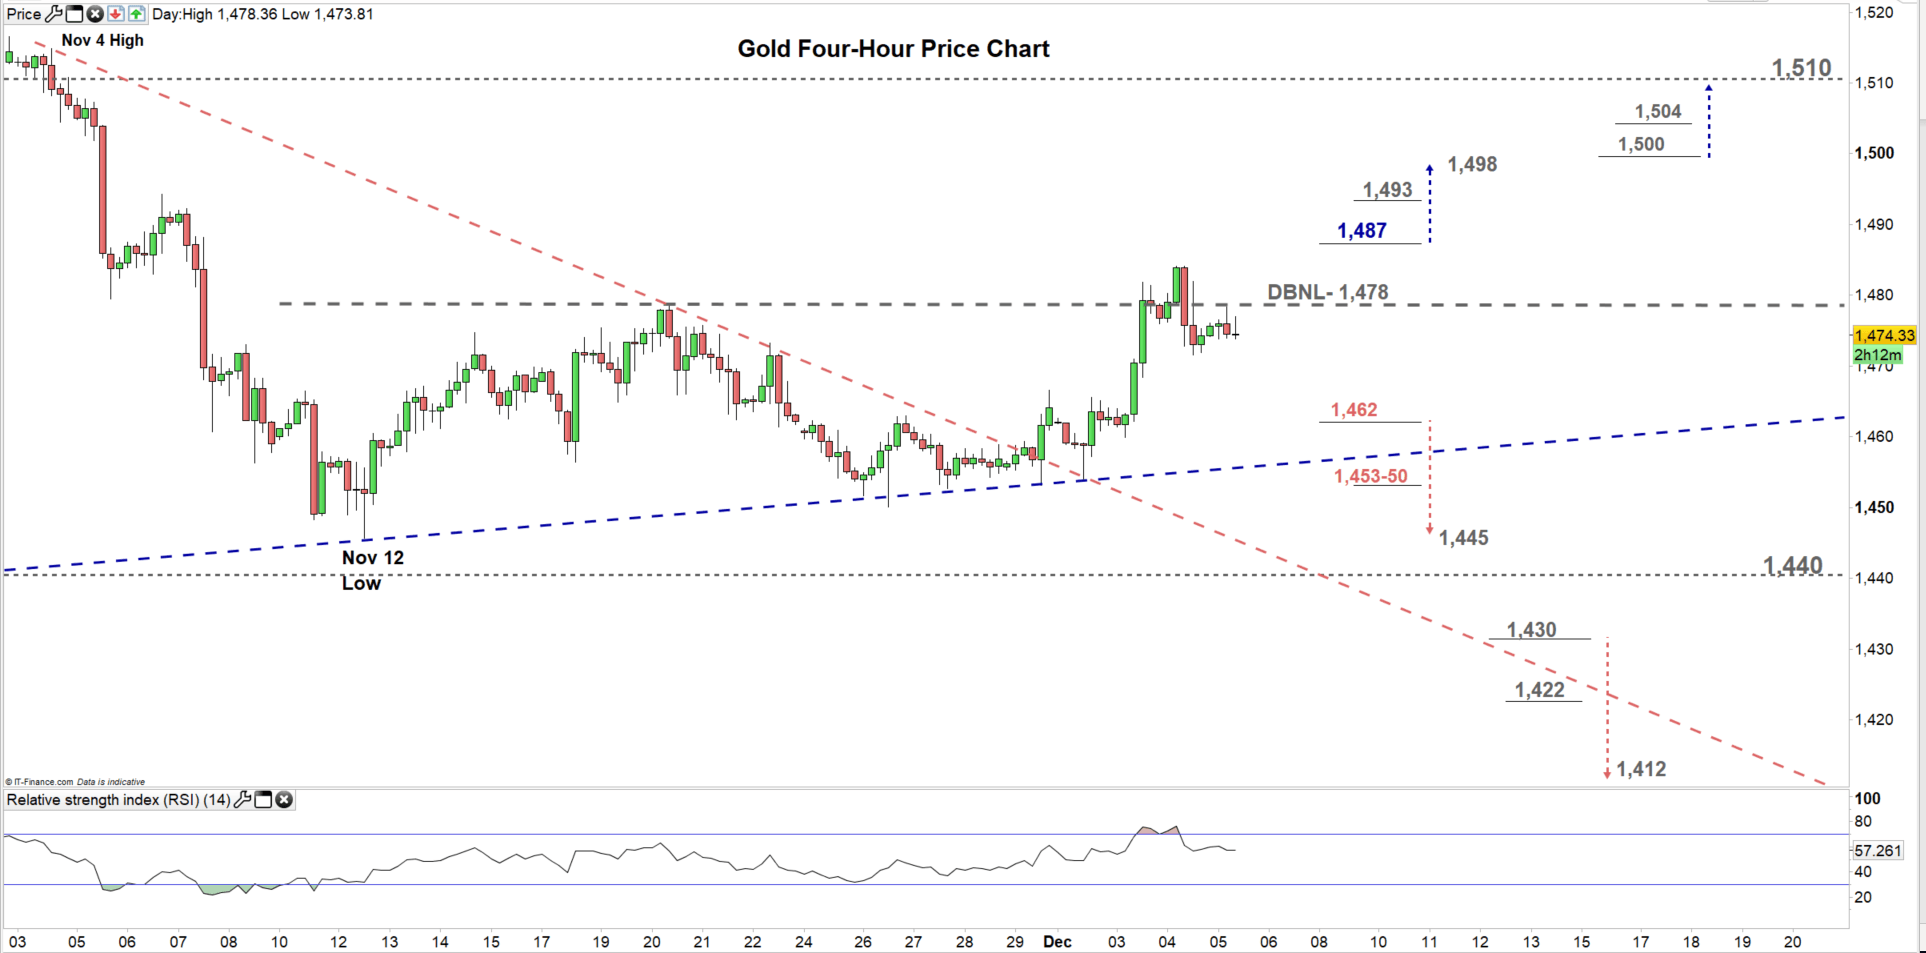
From the four-hour chart, we notice on Nov 29 Gold broke above the downtrend line originated from the Nov 4 high at $1,514. The price rallied after then printed yesterday $1,484 – its highest level in four weeks.
A break above $1,487 could cause more bullishness towards $1,498. Although, the weekly resistance level underlined on the chart should be monitored. On the other hand, a break below $1,462 may press XAU/USD towards the Nov 12 low at $1,445. Yet, the daily support area marked on the chart should be kept in focus.
See the chart to know more about key levels Gold would encounter in a further bullish/bearish scenario.
Join Me on Friday, DEC 6 at 14:00 GMT. In this session we will talk about most common directional and momentum indicators and how to use them
Written By: Mahmoud Alkudsi
Please feel free to contact me on Twitter: @Malkudsi


