


Talking Points:
- Gold technical strategy: Long-term mixed, Intermediate-term bearish, short-term bearish.
- IG Client Sentiment is currently showing +4.15 traders long for every one short, and given retail sentiment’s contrarian nature, this is bearish.
- Q3 Forecasts have just been released and are available in our Trading Guides. And if you’re looking for something more interactive in nature, please check out our DailyFX Live webinars.
To receive James Stanley’s Analysis directly via email, please sign up here.
On Friday, we looked at the continued bearish run in Gold prices as a series of heavy offers drove prices down to fresh seven-week lows. As we opened this week, sellers remained active to push prices down further, but since the open of the Euro session we’ve seen a bit of strength develop to bring prices back up to a prior point of support, around the $1,215-handle. On the four-hour chart below, we’re looking at this morning’s bounce up to a prior point of support.
Gold Prices Bounce After Setting Fresh Low – Prior Support Showing Near-Term Resistance

Chart prepared by James Stanley
At this point, traders utilizing bearish continuation approaches would need to be comfortable with just how oversold the Gold market is right now. The bearish move in Gold prices started over a month ago, just ahead of the Senate testimony of ousted FBI Director, James Comey. And since that move started, there has been little slowdown or pullback. On the chart below, we’ve added the Relative Strength Index to indicate how oversold this move has become. Notice how RSI has begun to diverge, showing ‘higher lows’ on the indicator while price action moves down to lower-lows.
Gold Four-Hour Chart, RSI Divergence Indicating Oversold Market
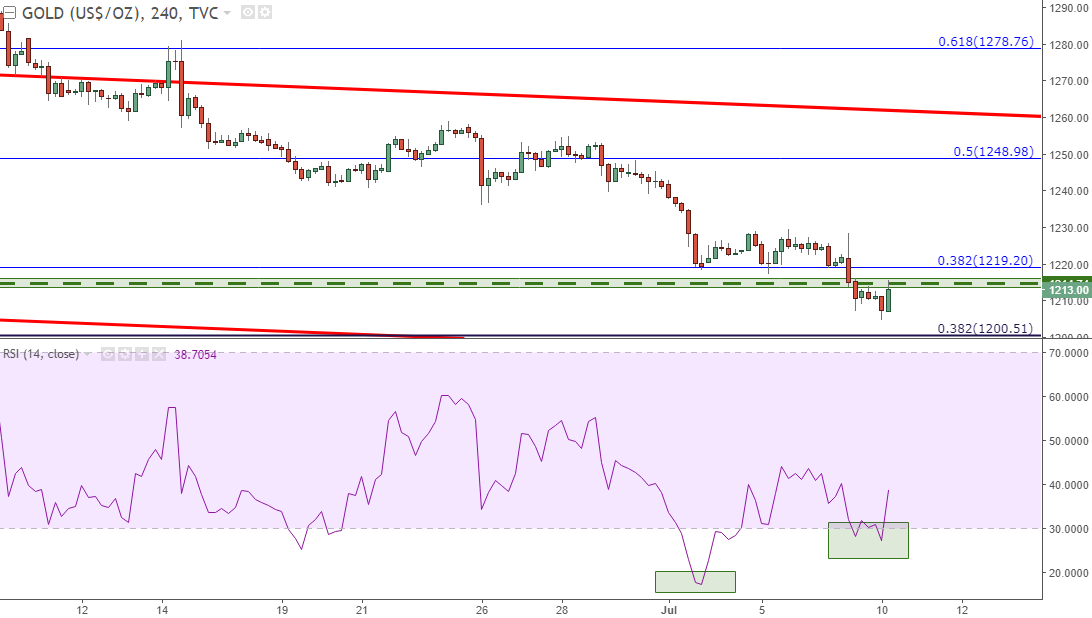
Chart prepared by James Stanley
Big Support Awaits at $1,200
As we mentioned in our last article, there is a big support level in Gold at the $1,200-handle. This is a psychological rounded value, which will have a tendency to produce some element of support or resistance on its own, but this is also the 61.8% retracement of the ‘lifetime move’ in Gold prices, taking the Bretton Woods fix of $35/oz up to the 2011 high. The 61.8% retracement of that move comes in at $1,200.51, and this level has seen numerous support and resistance inflections since coming back into play four years ago.
Gold Weekly Chart with Long-Term Support Highlighted at $1,200
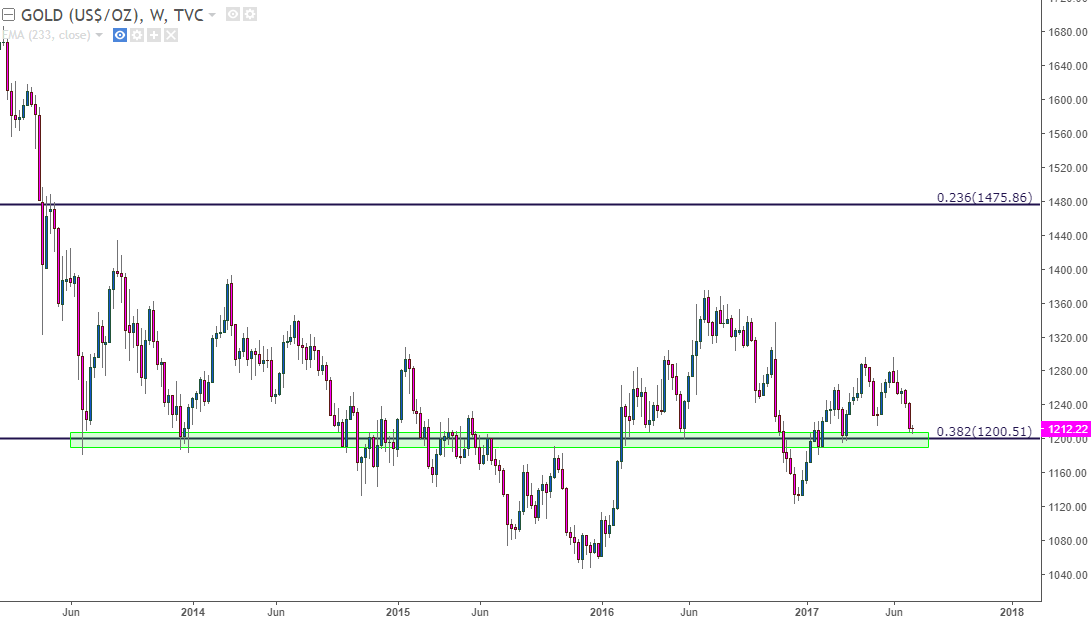
Chart prepared by James Stanley
The oversold nature of Gold prices makes entry a rather difficult matter given how far away prior swing-highs are. And given that we have a heavy slate of U.S. data on the horizon for later this week when Fed Chair Janet Yellen testifies in front of Congress on Wednesday and Thursday, there should be an abundance of drivers to keep this market volatile.
Traders looking to add bearish exposure to Gold prices can look for a cleaner entry setup by awaiting some element of resistance; so that bearish continuation approaches can become attractive again as risk could be more properly managed. Notice that there are considerable distance between these three points of potential resistance, and this just highlights how aggressive this bearish move has been; which also means that a corresponding retracement could run deep while the bearish trend still remains active. Should price re-break above the $1,248.98 point, which is the 50% retracement of the most recent major move, bearish approaches will no longer be as attractive, and this can be an interesting area to investigate for stop placement should $1,241 come into play as resistance.
Gold Four-Hour Chart with Potential Resistance Levels Applied
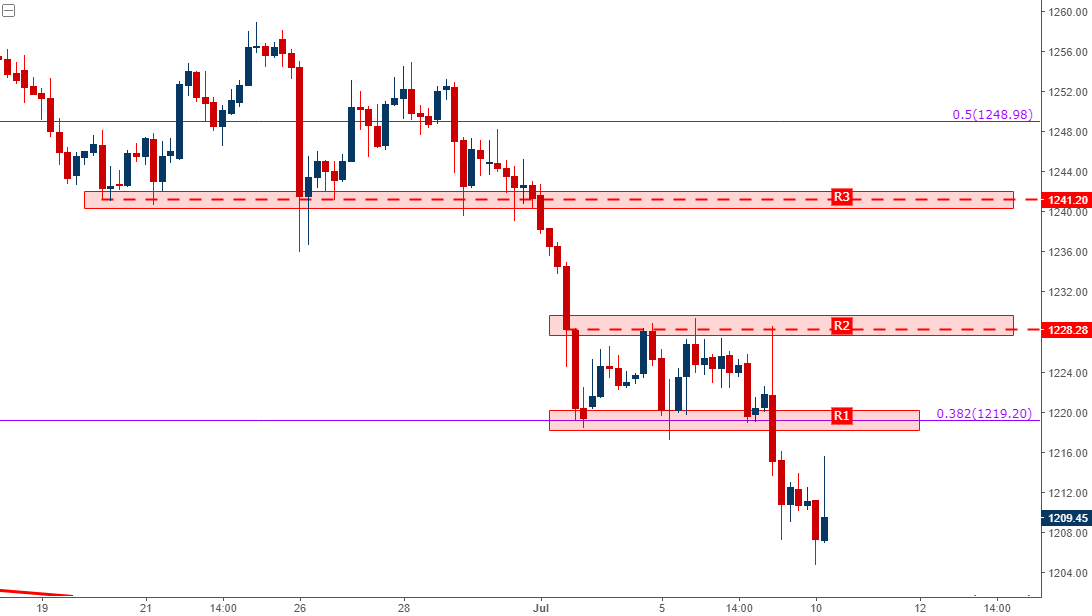
Chart prepared by James Stanley
--- Written by James Stanley, Strategist for DailyFX.com
To receive James Stanley’s analysis directly via email, please SIGN UP HERE
Contact and follow James on Twitter: @JStanleyFX


