


To receive James Stanley’s Analysis directly via email, please sign up here.
- Gold Technical Strategy: Intermediate-term (past 3 months) mixed as we approach the 50% retrace of the ‘Trump Trade,’ short-term price action is bullish.
- Gold prices are continuing to run-higher after eclipsing numerous resistance levels.
- If you’re looking for trading ideas, check out our Trading Guides. They’re free and updated for Q1, 2017. If you’re looking for ideas more short-term in nature, please check out our Speculative Sentiment Index Indicator (SSI).
In our last article, we looked at the continued-move higher in Gold prices as the market was retracing a previously bearish trend. The election-inspired trend sent Gold prices lower by more than $225 in a little over a month to tally a peak-to-trough run of -16%. But shortly after the Fed hiked rates in December, Gold prices began moving-higher and haven’t yet stopped.
This has produced a rather clean bullish trend channel as prices have been running higher since setting that low in the second half of December (shown below).
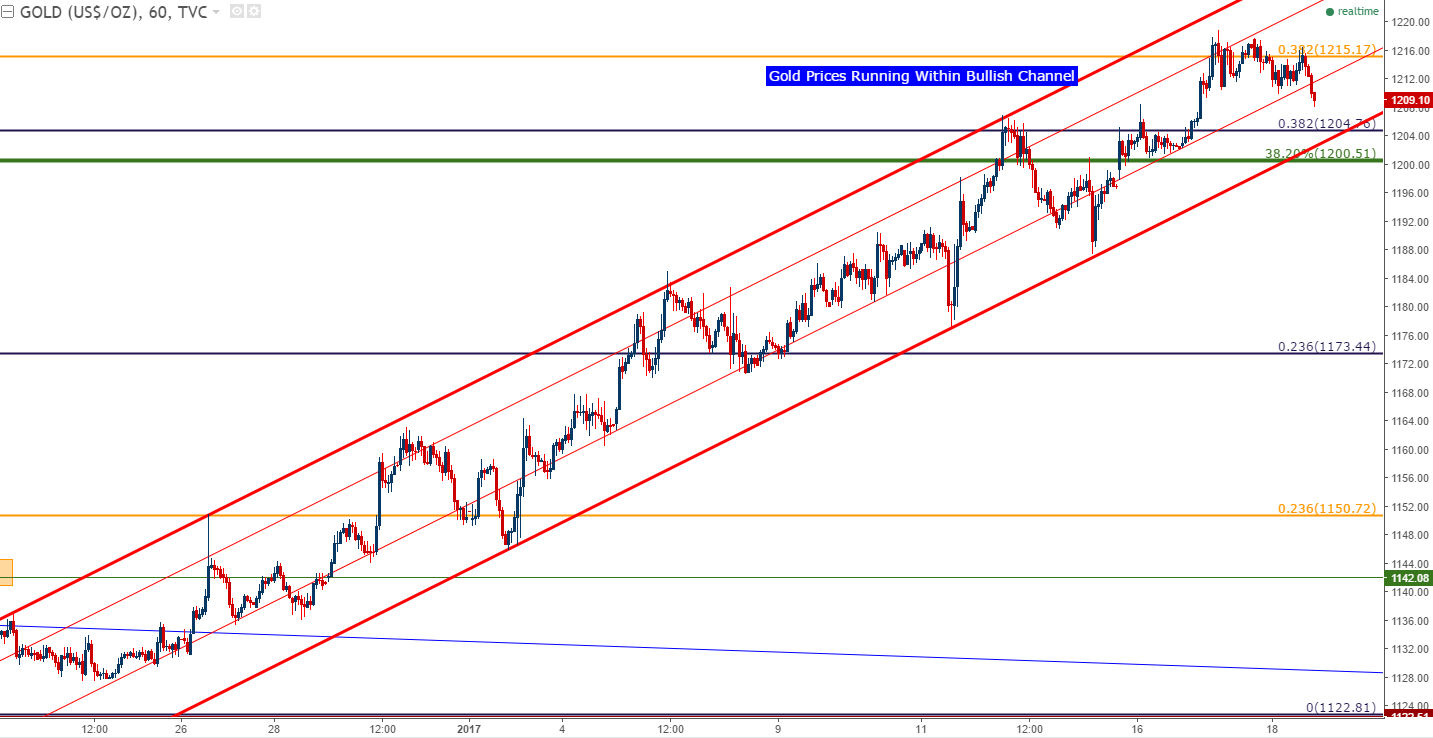
Chart prepared by James Stanley
This bullish trend channel has already taken-out multiple points of resistance as traders have been bidding Gold prices higher. At $1,230.07 we have the 50% retracement of the post-Election move, and should this be taken out the bearish trend that had sent prices reeling after the election would be nullified.
Traders looking to execute bullish strategies can look to catch support off of prior resistance around the zone comprising $1,200-$1,204.76. Both of these prices are relevant Fibonacci levels and this zone had offered resistance when prices were on the way-up, so this can be a very opportune zone to look for that next zone of ‘higher low’ support.
Given the veracity of the move-higher, bears will likely want to wait for a break of swing support levels at $1,187.50 or $1,177 before entertaining down-side approaches.
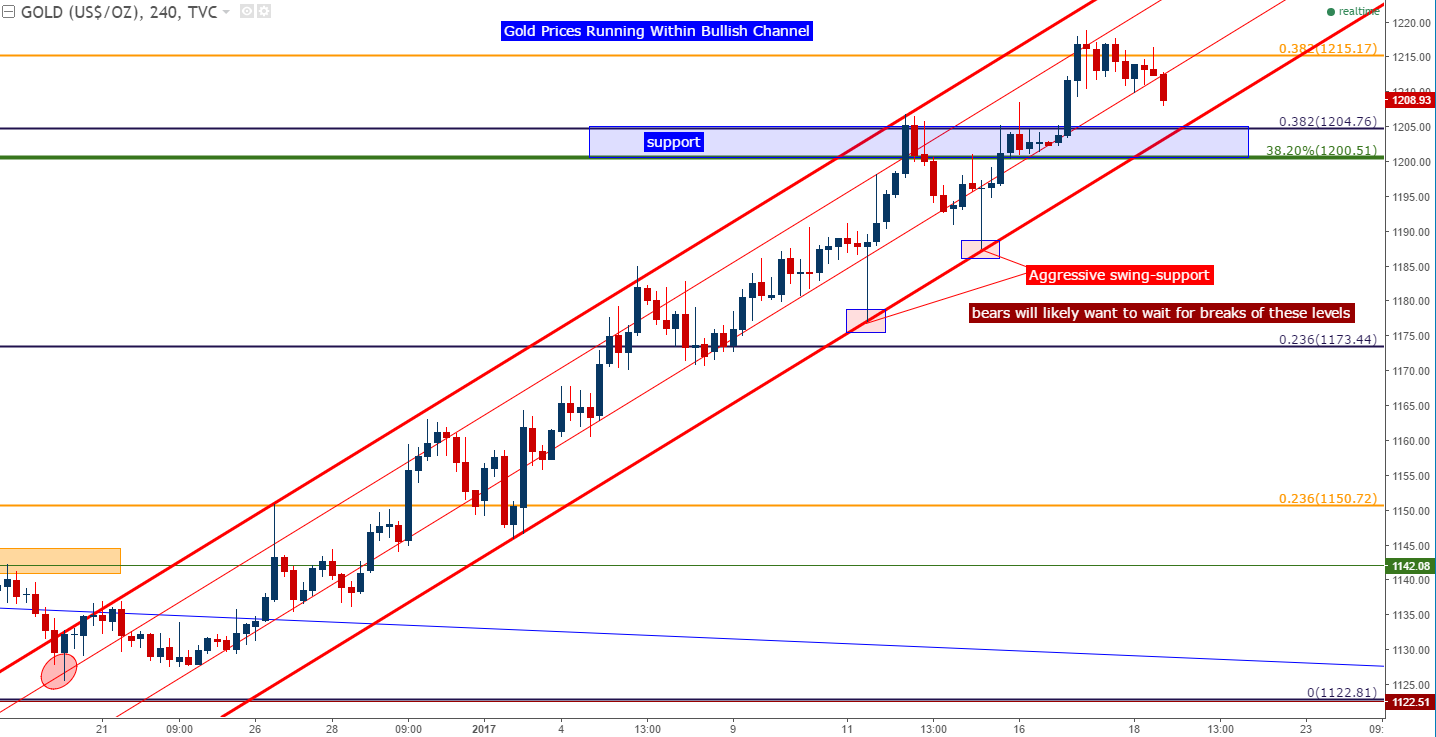
Chart prepared by James Stanley
--- Written by James Stanley, Strategist for DailyFX.com
To receive James Stanley’s analysis directly via email, please SIGN UP HERE
Contact and follow James on Twitter: @JStanleyFX


