


What can traders expect from USD/JPY in a year of US rate hikes? Click here for our thoughts.
Highlights:
- USD/JPY technical strategy: long with trailing stop at 110.95
- USD/JPY above Ichimoku Cloud, persistently weak JPY favors further upside
- IGCS continues to forecast USD may Rally Further vs. Japanese Yen
Don't look now (ok, go ahead), but JPY weakness is becoming a persistent theme again that traders are watching. Amidst the flurry of central bank activities in mid-June, the Bank of Japan (BoJ) failed to discuss the process of tapering that they will embark on when the Abe government if they survive the coming election, decides to end their Qualitative and Quantitative Easing (QQE) program.
While a lot of focus will be on USD/JPY, traders would be well served to look at relatively stronger currencies like the Canadian Dollar, New Zealand Dollar, or Euro against the Japanese Yen. While USD/JPY has been choppy, a persistent theme on the price chart has been higher lows from the April and 2017 low of 108.13. Traders are now keeping an eye on UST yields that tend to see gains (Treasuries are getting sold) as USD/JPY rises.
The price on Tuesday broke above the May 24 high of 112.13, and now focus may turn to the May 17 high, May 17 provided one of the most aggressive sell-offs in a year, at 113.125. In no uncertain terms, the USD does not look to be the best play against the JPY given that there are stronger currencies that are likely a better play vs. the JPY, but if Yen weakness intensifies, we could see further upside still. The sentiment picture explained below helps to show another argument for focusing higher on JPY crosses.
The trendline on the chart below is drawn from closing highs going back to December 15. The price that meets the point along the trendline is near 113.15. A breakout validated by a daily close above the trendline would argue a persistent theme of JPY weakness is upon us with plenty of opportunities that we’ll work to keep you aware.
Join Tyler in his Daily Closing Bell webinars at 3 pm ET to discuss market developments.
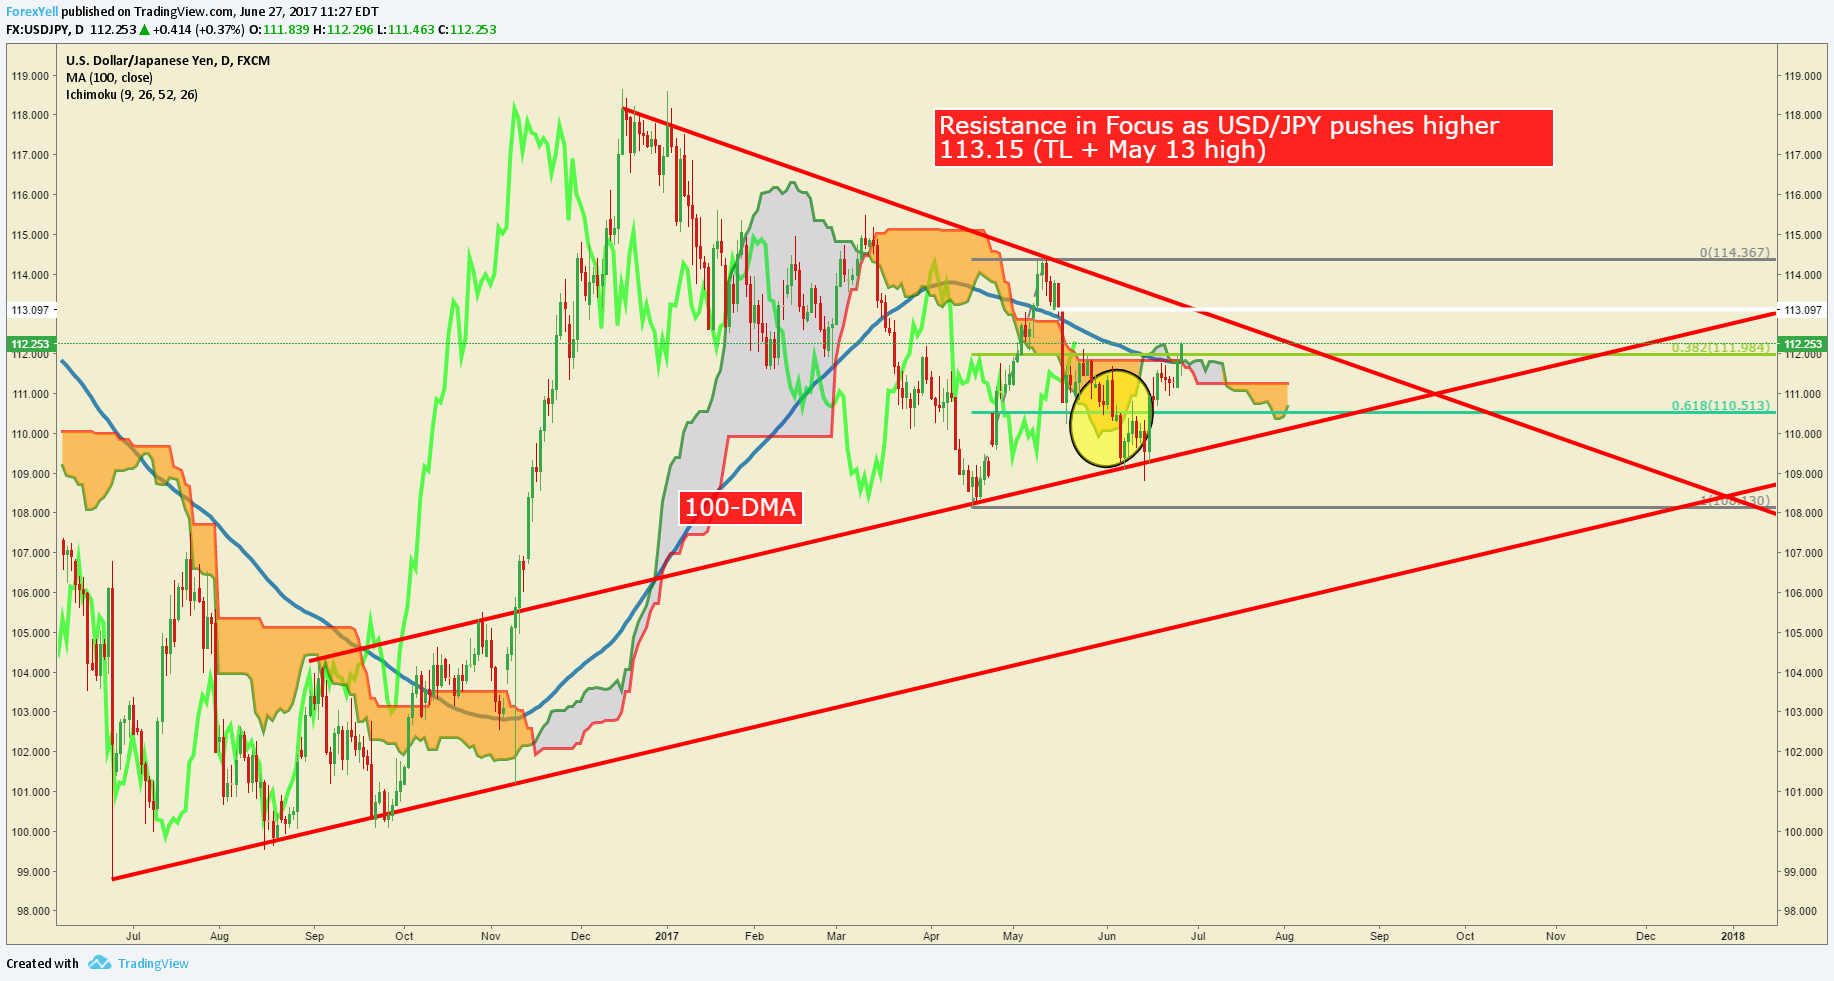
Chart Created by Tyler Yell, CMT
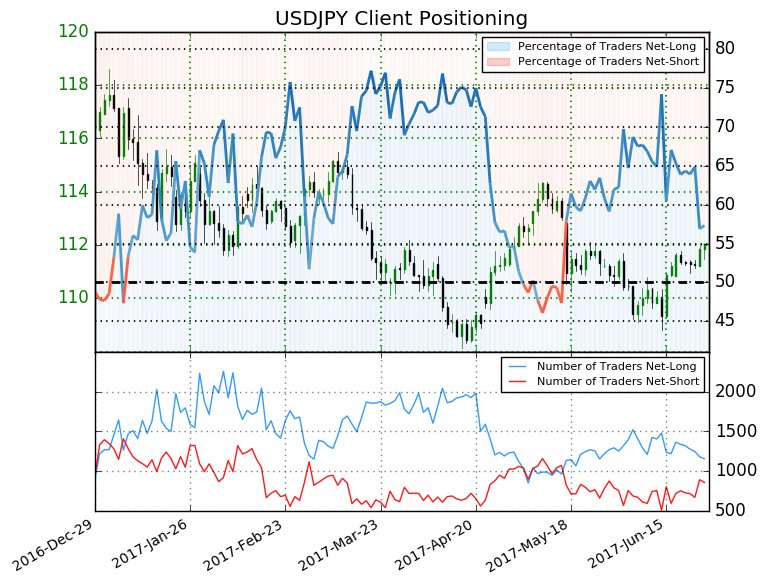
USD/JPY IG Trader Sentiment:US Dollar may Rally Further versus Japanese Yen
What do retail traders’ buy/sell decisions hint about the JPY trend? Click here to find out.
USDJPY: Retail trader data shows 57.3% of traders are net-long with the ratio of traders long to short at 1.34 to 1. In fact, traders have remained net-long since May 17 when USDJPY traded near 113.757; price has moved 1.3% lower since then. The number of traders net-long is 11.6% lower than yesterday and 15.2% lower from last week, while the number of traders net-short is 3.6% higher than yesterday and 8.4% higher from last week.
We typically take a contrarian view to crowd sentiment, and the fact traders are net-long suggests USDJPY prices may continue to fall. Yet traders are less net-long than yesterday and compared with last week. Recent changes in sentiment warn that the current USDJPY price trend may soon reverse higher despite the fact traders remain net-long. (Emphasis Mine)
---
Written by Tyler Yell, CMT, Currency Analyst & Trading Instructor for DailyFX.com
To receive Tyler's analysis directly via email, please SIGN UP HERE
Contact and discuss markets with Tyler on Twitter: @ForexYell


