


See How FXCM’s Live Clients Are Positioned In FX & Equities Here
Talking Points:
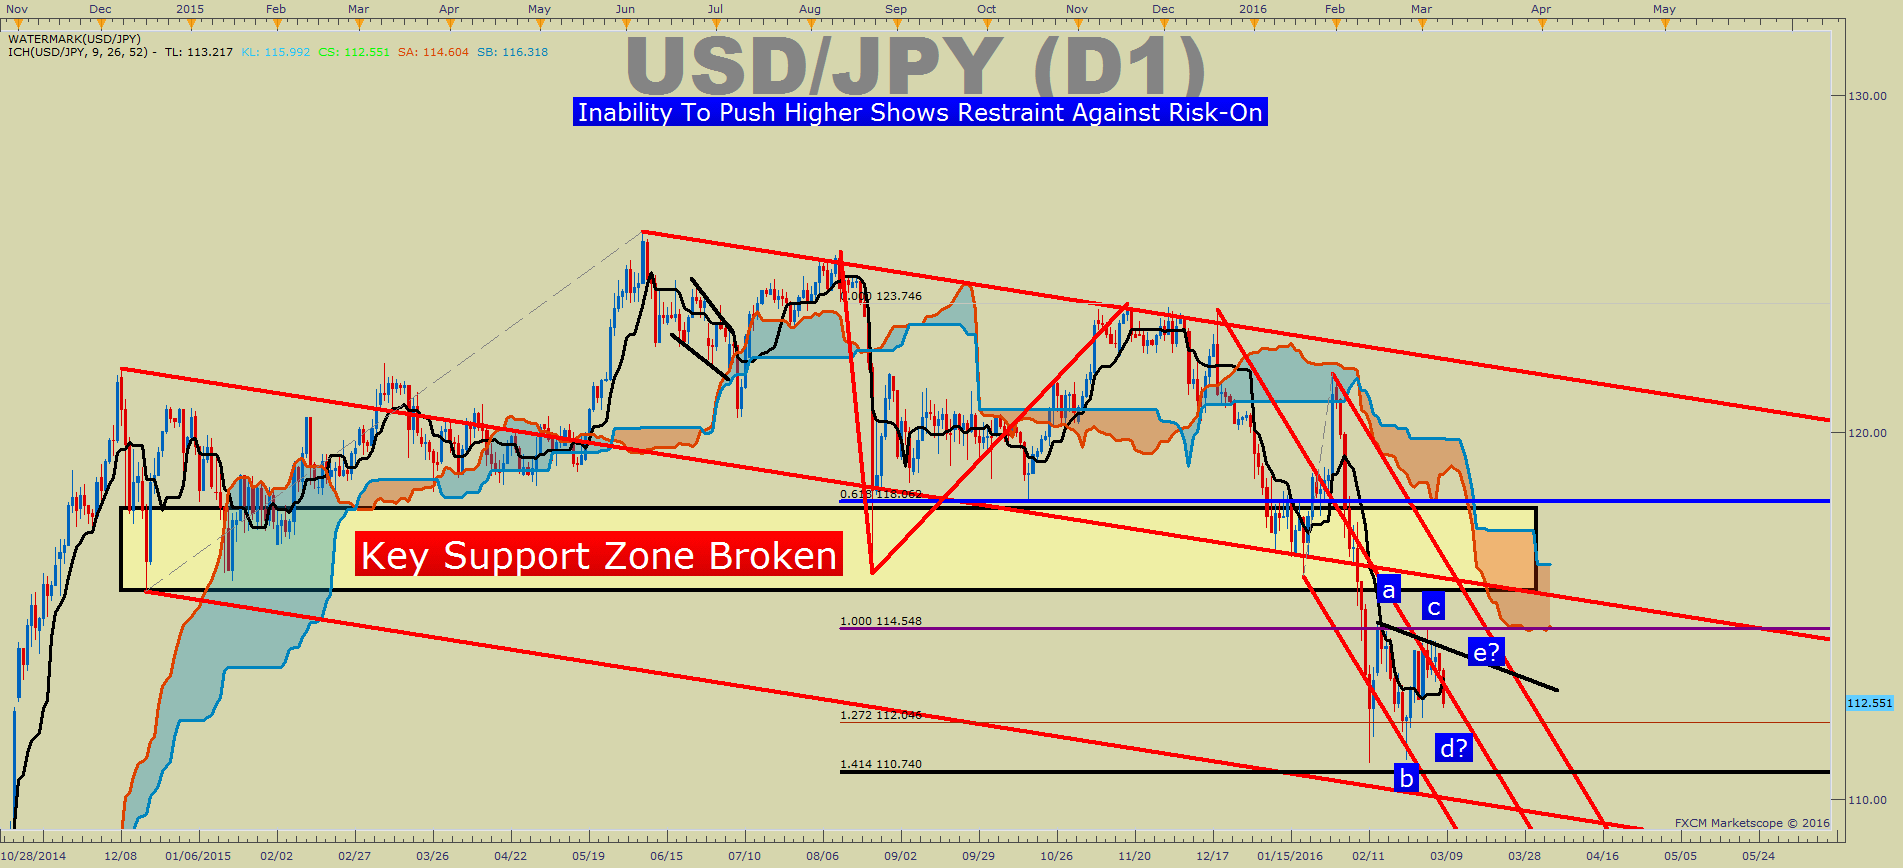
- USD/JPY Technical Strategy: Awaiting Breakdown Below 111.67 Feb. 12 Low
- Risk Sentiment Is Better But JPY Refusing To Sell-Off Is Worrisome In The Long Run
- COT- Largest Net Long Position for JPY Specs Since January 2012
The fundamentals of the global macro picture have changed a little, but nowhere near the amount that the sentiment has turned positive. A key development of this week is that Crude Oil, feared to be a ‘canary in the coalmine’ of the global economy is now positive on the year with ICE Brent Crude up 10%+YTD. Equities have surged as well, albeit they are still negative for the year by a few percentage points.
However, markets appear confused. If you look at the Commitment of Trader’s report from the CFTC, you will notice two rare extremes. Long positions on a 52-week basis are at their highest levels for both the Japanese Yen and the Australian Dollar. This shows an important divide as JPY is bought in times of extreme riks-off, and the Australian Dollar is bought at times of positive risk sentiment.
Bringing this view together shows that the next move could be very aggressive. Why? Because someone will be forced out of the position, and they will likely be forced to jump on the other position that they were fighting. Looking at the chart below, that could be long Japanese Yen if risk turns sour again. To validate that view, we would need to see a breakdown on the chart and price staying below 115.55, the late December 2014 low, and the bottom of the range highlighted on the chart.
Another surprising development in the last 24-hours is that 40-year Japanese government bonds are paying less than U.S. two-year notes for the first time since 2008. Japan's 40-year bond yields 0.8%, versus 0.9% for the 2018 note. Let’s hope we’re not going down that path again.
115.55 Key Resistance on USD/JPY
Key Levels from Here
JPY does appear to be attracting buyers, which is obvious by the CoT position extremes shown earlier. However, a breakdown through the 111.67/90 February 12 & 25 low would likely align with a larger risk-off move that could take equity lower with it.
For now, it appears we have signs of stabilization that have underlined the short-term rally in risk that we have seen from the February low. For now, key support will remain at the post-negative interest rate low of 110.95, and beyond there to the February 12 & 25 low.
While we remain in a larger bearish channel from early December, the forms of resistance are three-tiered. The top-tier remains the low of the December 2014 low of 115.55. Secondly, a zone of 114.20/56 that comprises the March 1 & 2 high followed lastly by the March 7 low at 113.23.
T.Y.
Interested In Learning the Traits of FXCM’s Successful Traders? If So, Click Here


