


USD Technical Outlook
- DXY fell back to support late last week
- Trust support until broken
- A break is seen as leading to modest selling

US Dollar Technical Outlook: DXY Sitting Solid Support
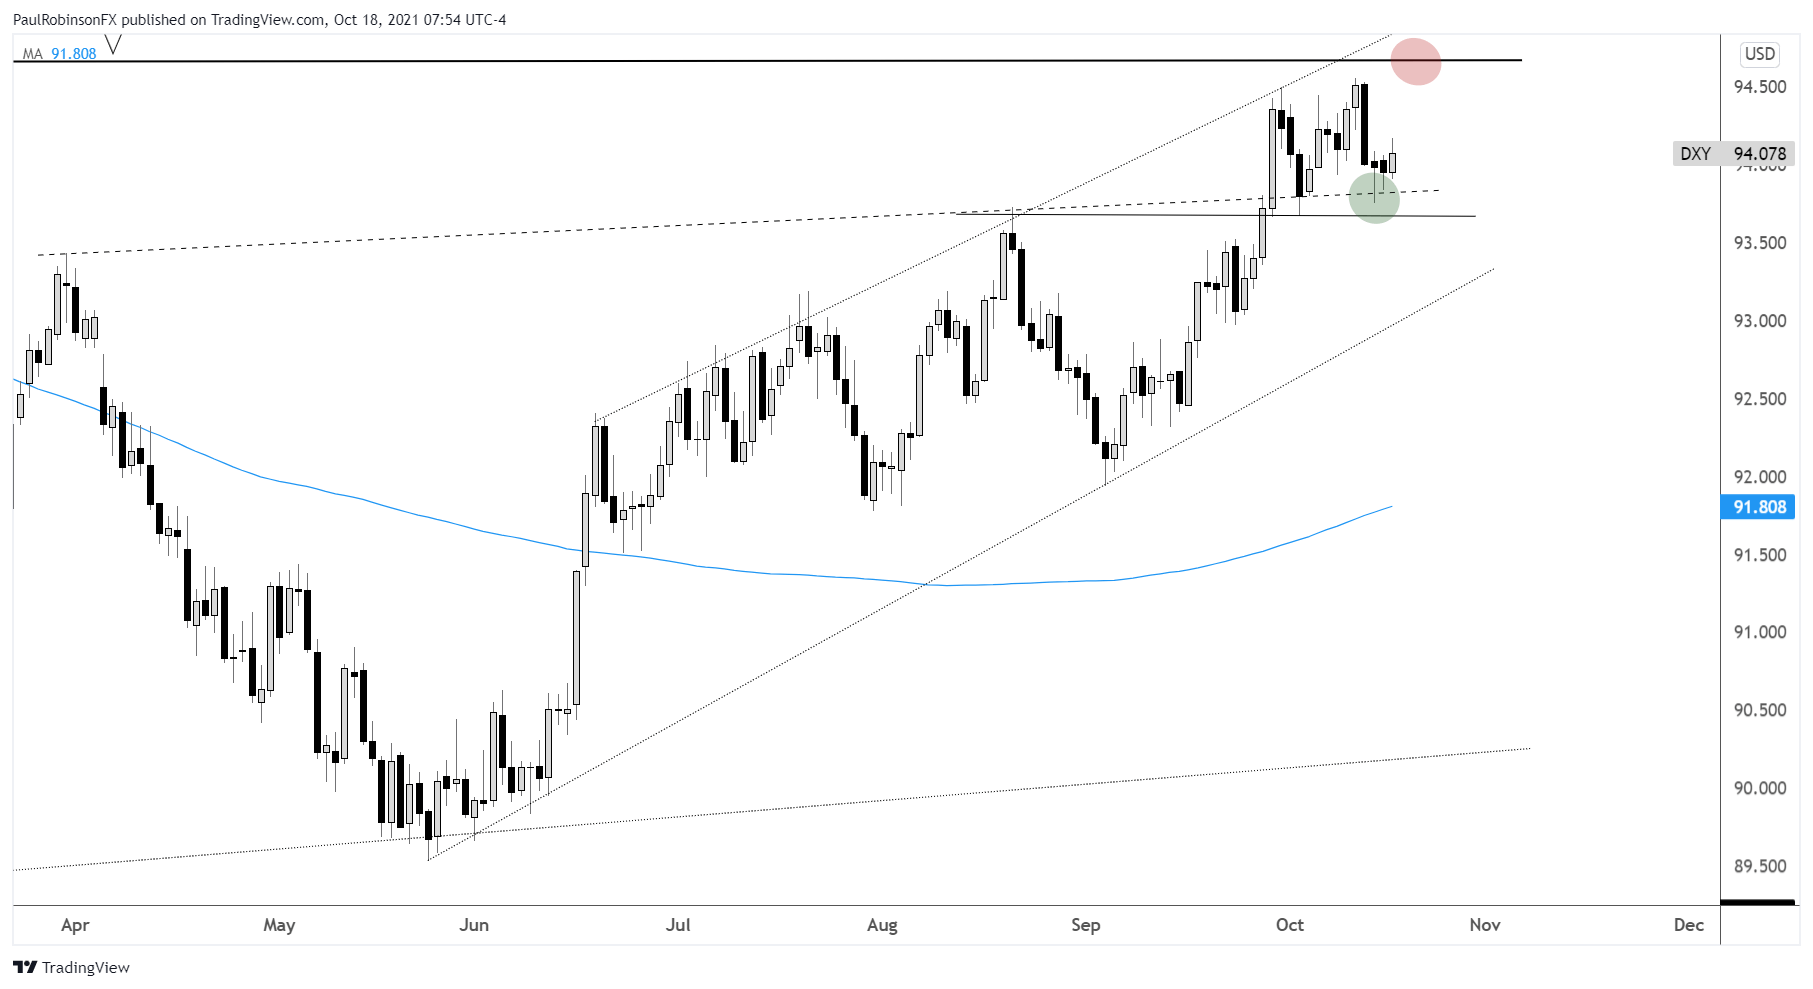
In last week’s commentary we discussed how the US Dollar Index (DXY) looked headed higher out of a developing wedge, and that outlook had some legs – for a minute. The wedge breakout quickly failed just ahead of a significant area of resistance (94.67) formed during the early days of the pandemic.
The sharp one-day decline on Wednesday put important support back into play. How things unfold here will be meaningful to the short-term outlook. There is both horizontal and trend-line support in confluence in the area of 93.85 to 93.67.
A peak formed there during August that become support on a pullback early in the month, and so far again it is holding as support. But price action coming off of it isn’t very forceful, but we will respect it as support until it breaks.
A hold above could see the DXY run back towards the recent high at 94.56 up to 94.67 where the much larger level lies. This could make for some rangebound activity that sets up a move later if resistance can’t break.
In the event we see a daily closing candle below 93.67, look for another leg lower to ensue with the next line of support coming via a trend-line dating to the May low. The sloping support was touched numerous times during that bottoming period, then again validated as a trend-line in early September.
It currently lies down just above 93 and rising. This would certainly be an interesting test as the trend since May comes under pressure. If we see weakness to that level then we would want to pay close attention to price momentum.
For the immediate future, would-be and existing longs may want to use support as a spot to assess stops while would-be shorts may want to wait for confirmation of a support break before entering or becoming more aggressive with existing short positions.

US Dollar Index (DXY) Daily Chart
Resources for Forex Traders
Whether you are a new or experienced trader, we have several resources available to help you; indicator for tracking trader sentiment, quarterly trading forecasts, analytical and educational webinars held daily, trading guides to help you improve trading performance, and one specifically for those who are new to forex.
---Written by Paul Robinson, Market Analyst
You can follow Paul on Twitter at @PaulRobinsonFX


