US Dollar Outlook:
- The US Dollar (via the DXY Index) continues to trade lower after losing the uptrend from the February and March swing lows.
- Higher inflation typically feeds into higher interest rates amid the expectation for central bank tightening. But amid an otherwise resolute Federal Reserve intent on keeping rates low through the end of the pandemic, the US Treasury yield curve has remained stable in the wake of the March US inflation report.
- The IG Client Sentiment Index suggests that USD/JPY has a bearish bias.
US Dollar Continues to Slide
A banner US inflation report was perhaps the best opportunity the US Dollar had this week for a significant catalyst, but the market has walked away from the March data, well, unimpressed. Even as the pandemic-induced base effect makes it way through the data now and for the next few months, Fed Chair Jerome Powell has been clear in his and the FOMC’s intent to keep providing extraordinary support to markets until the crisis in well behind the US economy.


US Treasury Yield Curve (1-year to 30-years) (April 2016 to April 2021) (Chart 1)
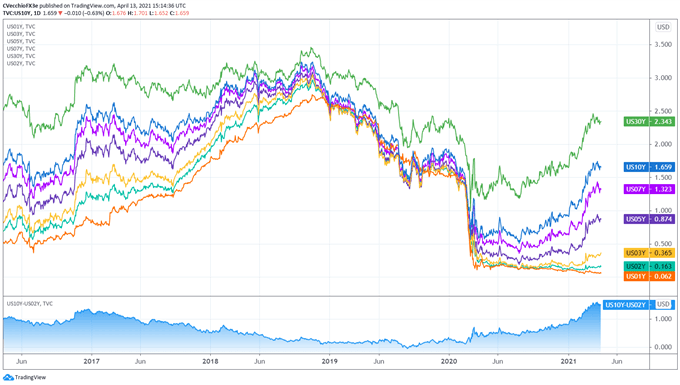
Higher inflation typically feeds into higher interest rates amid the expectation for central bank tightening. But amid an otherwise resolute Federal Reserve intent on keeping rates low through the end of the pandemic, the US Treasury yield curve has remained stable in the wake of the March US inflation report, trading in a similar range (across the curve, as measured by the 2s10s in the lower panel of Chart 1) for the past several weeks.
Monthly Forex Seasonality Summary – April 2021 (Chart 2)
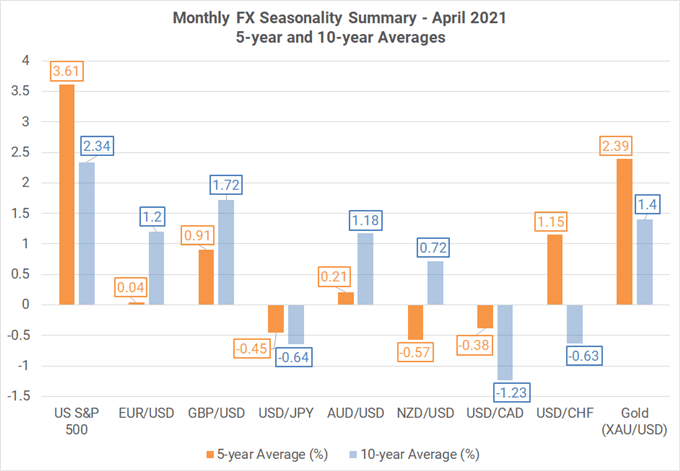
The recent pullback in the DXY Index requires a needed context: seasonality. We’re in the worst month of the year for the US Dollar, with several major currencies like the British Pound, Canadian Dollar, and Japanese Yen having some of their best – if not the best – month of the year versus the greenback. This may prove to be a headwind for the DXY Index, and moreover, with US Treasury yields proving stable, an opportunity for USD/JPY rates to retrench further.
DXY PRICE INDEX TECHNICAL ANALYSIS: DAILY CHART (March 2020 to April 2021) (CHART 3)
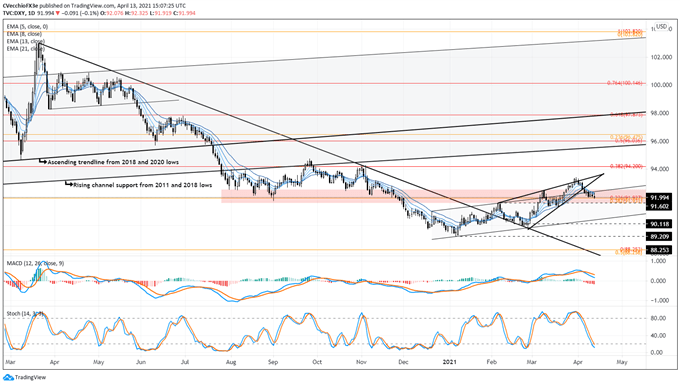
The US Dollar (via the DXY Index) continues to trade lower after losing the uptrend from the February and March swing lows. It’s possible that the DXY Index is in the throes of a bearish rising wedge formation, which ultimately calls for a return to the February low at 89.68. Bolstering the view for a deeper setback has been the return back into the rising parallel channel dating back to December 2020; this may be a failed bullish breakout attempt.
The DXY Index is below its daily 5-, 8-, 13-, and 21-EMA envelope, which is in bearish sequential order. Daily Slow Stochastics have moved into oversold territory, while daily MACD is trending lower albeit above its signal line. Confirmation for a deeper setback may emerge should the DXY break below the familiar confluence zone of support and resistance going back to late-July 2020, as well as the 23.6% Fibonacci retracement of the 2018 low/2020 high range and the 38.2% Fibonacci retracement of the 2011 low/2020 high range.


USD/JPY RATE TECHNICAL ANALYSIS: DAILY CHART (March 2020 to April 2021) (CHART 4)
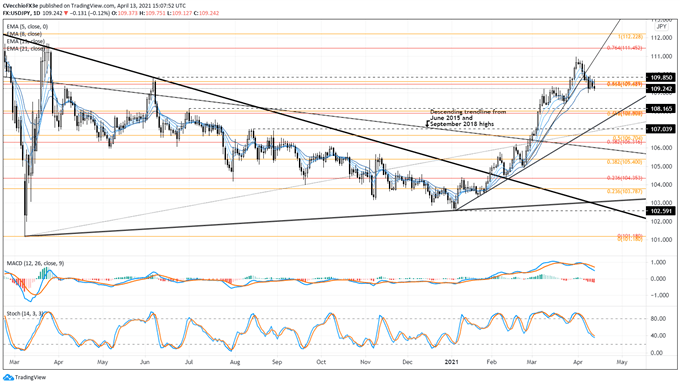
USD/JPY rates have lost their uptrend from the late-February and March swing lows, and concurrent to the setback in US Treasury yields and an otherwise bearish seasonal tendency for the pair, the groundwork may have been laid for further losses. While momentum indicators are still benign, it’s noteworthy that price action shows spot prices below their daily 5-, 8-, 13-, and 21-EMA envelope. It may be the case that other USD-pairs have a greater tendency for volatility, but as a leading indicator of sorts, if USD/JPY rates are struggling, it likely means that US Treasury yields aren’t climbing, which has been the backbone of broad greenback strength in recent months.
IG Client Sentiment Index: USD/JPY RATE Forecast (April 13, 2021) (Chart 5)
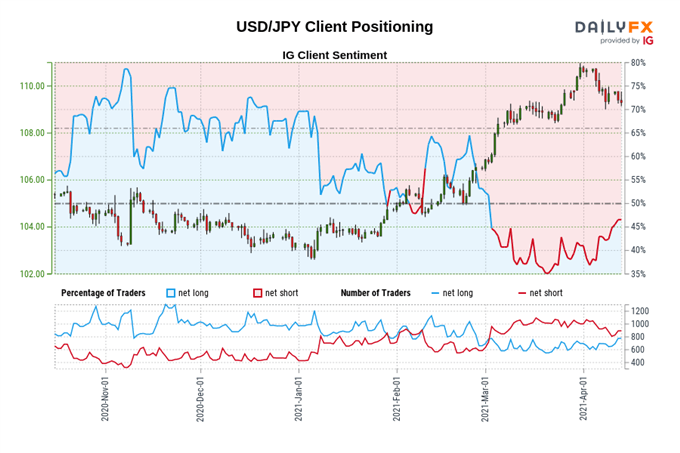
USD/JPY: Retail trader data shows 46.32% of traders are net-long with the ratio of traders short to long at 1.16 to 1. The number of traders net-long is 12.63% higher than yesterday and 18.00% higher from last week, while the number of traders net-short is 4.92% lower than yesterday and 10.65% lower from last week.
We typically take a contrarian view to crowd sentiment, and the fact traders are net-short suggests USD/JPY prices may continue to rise.
Yet traders are less net-short than yesterday and compared with last week. Recent changes in sentiment warn that the current USD/JPY price trend may soon reverse lower despite the fact traders remain net-short.
--- Written by Christopher Vecchio, CFA, Senior Currency Strategist


