


Technical Forecast for the US Dollar: Neutral
- The DXY Index’s breakdown throughthe rising trendline from the April 2011 and February 2018 lows has persisted despite losses clawed back in recent days.
- News that Republican Senate Majority Leader Mitch McConnell would break with US President Donald Trump over a fiscal stimulus package helped trigger a bounce in US real yields, helping lift the US Dollar.
- The IG Client Sentiment Index suggests that EUR/USD and GBP/USD rates could rally.
US Dollar Fights Back, but Still in Trouble
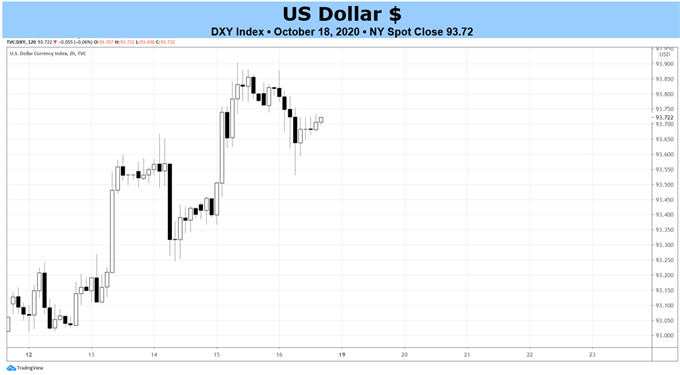
The US Dollar (via the DXY Index) ended the first full week of October on a weak note, closing at its lowest level in nearly a month thanks to a sharp drop on Friday. Synchronous shifts in both technical and fundamental moorings now suggest that the US Dollar may be starting its next leg lower: the pullback in US real yields around US political headlines; and the break of the DXY Index’s uptrend from the September swing lows, all the while failing to climb back above a near-decade long rising trendline. The rest of October is shaping up to be an ugly month for the US Dollar, from this strategist’s perspective.
DXY PRICE INDEX TECHNICAL ANALYSIS: WEEKLY CHART (NOVEMBER 2016 to OCTOBER 2020) (CHART 1)

Even with the gains seen in the past week, the DXY Index has yet to climb back above the rising trendline from the April 2011 and February 2018 lows.Similarly, the downtrend from the March and May swing highs remains intact (seen on the next chart). To this end, while the fundamental headwinds are shifting, the technical evidence has not yet mounted for a significant bullish reversal.
That said, technical momentum is beginning to shift on the weekly timeframe, with the DXY Index trading above the weekly 4- and 13-EMAs, while still below the weekly 26-EMA. Weekly MACD is trending higheralbeit in bearish territory, while Slow Stochastics are turning higher again towards their median line. towards oversold territory.
In previous weeks, the DXY Index failure occurred at the 38.2% Fibonacci retracement of the 2017 high/2018 low range near 94.20. The 94.00/20 area has been a dynamic band of support/resistance since late-July (further reinforcing the severity of the recent breakdown). Should the DXY Index clear this level, however, there would be greater evidence of a topside move developing.
DXY PRICE INDEX TECHNICAL ANALYSIS: DAILY CHART (OCTOBER 2019 to OCTOBER 2020) (CHART 2)
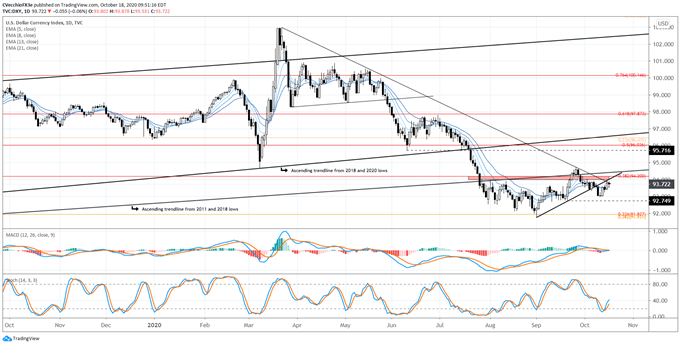
The short-term downtrend from the late-September and early-October swing highs has been broken, but the downtrend from the March and May swing highs remains in place – effectively the pandemic downtrend. As the DXY Index remains below the rising trendline from the 2011 and 2018 lows, as well as the 38.2% Fibonacci retracement of the 2017 high/2018 low range near 94.20, it’s too soon to say that the bearish momentum that developed during the pandemic has truly subsided.
Yet, the DXY Index is now above its daily 5-, 8-, 13-, and 21-EMA envelope, which is quickly aligning in bullish sequential order. Daily MACD is starting to rise in bullish territory, while Slow Stochastics is quickly rallying towards its neutral line. As noted previously, “gains through 94.00/20 would signify a potential bullish reversal. Otherwise, the US Dollar will remain on exceptionally weak footing.”

CFTC COT US Dollar Futures Positioning (October 2019 to October 2020) (Chart 3)
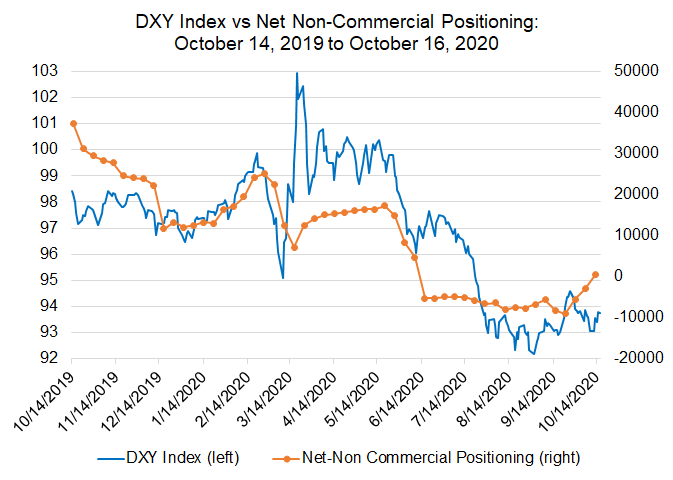
Looking at positioning, according to the CFTC’s COT for the week ended October 13, speculators eliminated their net-short US Dollar positions and flipped to a minor net-long position of 0.4K contracts (437 in total), from the 3K net-short contracts held in the week prior. This is the first time since the week ended June 9 that speculators in the futures market have been net-long the US Dollar.
IG Client Sentiment Index: EUR/USD Rate Forecast (October 16, 2020) (Chart 4)
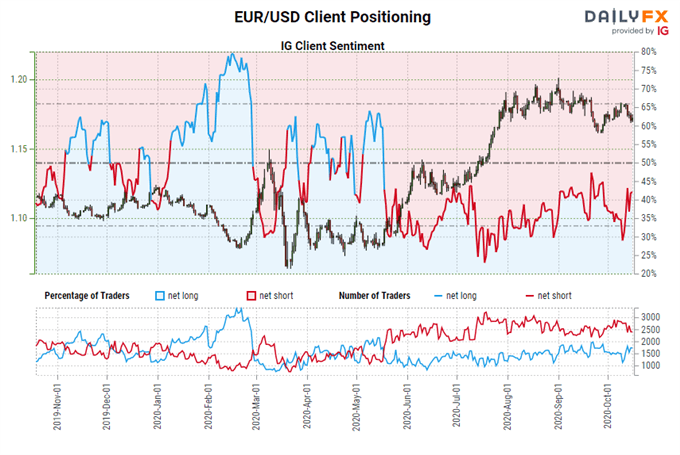
EUR/USD: Retail trader data shows 38.27% of traders are net-long with the ratio of traders short to long at 1.61 to 1. The number of traders net-long is 10.72% lower than yesterday and 22.89% higher from last week, while the number of traders net-short is 5.90% higher than yesterday and 11.80% lower from last week.
We typically take a contrarian view to crowd sentiment, and the fact traders are net-short suggests EUR/USD prices may continue to rise.
Positioning is more net-short than yesterday but less net-short from last week. The combination of current sentiment and recent changes gives us a further mixed EUR/USD trading bias.

--- Written by Christopher Vecchio, CFA, Senior Currency Strategist


