U.S. Indices Technical Highlights:
- S&P 500 stalling around prior record high, rolling over
- Dow Jones could soon test important March 2020 trend-line
- Nasdaq the weakest of the three, has room to decline
Dow Jones, S&P 500, Nasdaq 100 Charts Rolling Over
The last time we looked at indices here on May 19, this was what I had to say – “The market appears to be on the verge of rolling over into a meaningful decline as we see speculative fervor continue to cool…” And so it finally looks to be the case after rallying a bit from support.
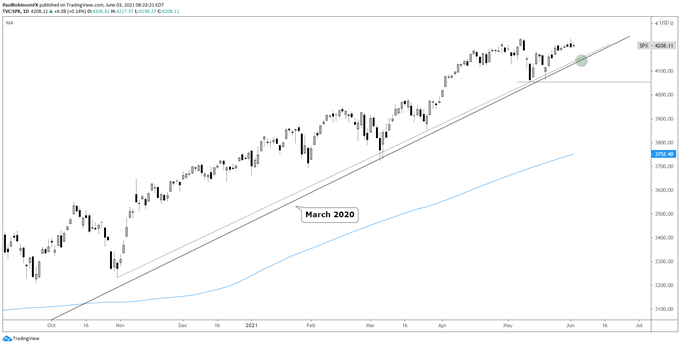
The S&P 500 held a trend-line from the late October low and March 2020 coronavirus low. The October line has been validated on a few occasions and could again come into play very soon. It lies in confluence with the March 2020 trend-line around the 4150 mark, give or take a few handles.
A strong dive lower from the recent malaise, without a bounce off support, would suggest the market is perhaps ready to undergo a broader correction. For this outlook to fully gain momentum a lower-low below 4056 would need to eventually develop.
Since bottoming last year we have yet to see an intermediate-term lower-low develop, so indeed the change in character would be worth taking seriously. But before getting to that juncture, the trend-lines mentioned above could soon become the first thresholds to pay close attention to.
Shorts will want to watch for signs of stabilization or a rejection at support that may warrant peeling back risk, while would-be longs could view positive price action as an opportunity to join the trend higher.


S&P 500 Daily Chart

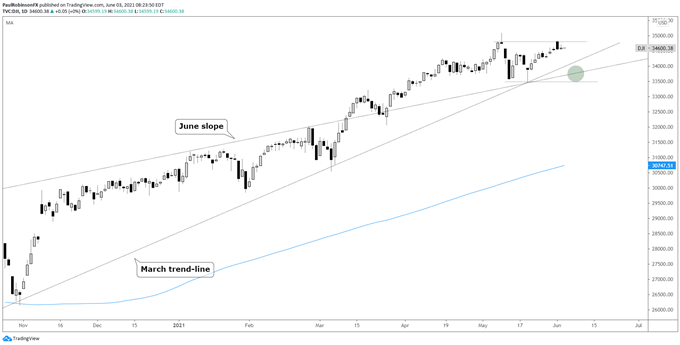
The Dow Jones is coming off a failed attempt to trade to a new record high, and may now be ready to visit the recently tested March 2020 trend-line. The deal is the same with the Dow as it is with the S&P, hold the trend-line and the trend remains upward, break it and the possibility of a broader decline increases. There is a slope from June and the recent low at 33473 that would need to be broken before becoming too bearish.
Dow Jones Daily Chart

Dow Jones Chart by TradingView
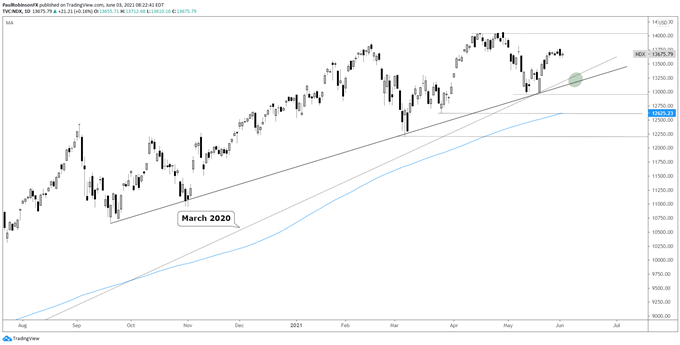
The Nasdaq 100 has been the weaker of the major US indices with it unable to approach its previous record high, and on that is viewed as a leader on the downside in any risk-off situation. There are a couple of important trend-lines to watch, one is the March 2020 trend-line as is the case with the S&P and Dow, and the other, which is quite solid, running up from September.
The Sep slope runs under the recent low and is in relative confluence with the March 2020 trend-line. This makes the ~13250/130 area rather significant. Hold and the trend remains neutral to up, but break and we could quickly see the 200-day at 12625 (&rising) or worse.
Nasdaq 100 Daily Chart

Nasdaq 100 Chart by TradingView
Resources for Forex Traders
Whether you are a new or experienced trader, we have several resources available to help you; indicator for tracking trader sentiment, quarterly trading forecasts, analytical and educational webinars held daily, trading guides to help you improve trading performance, and one specifically for those who are new to forex.
---Written by Paul Robinson, Market Analyst
You can follow Paul on Twitter at @PaulRobinsonFX


