


U.S. Indices Technical Highlights:
- S&P 500 rising into resistance area, pullback risk is high regardless
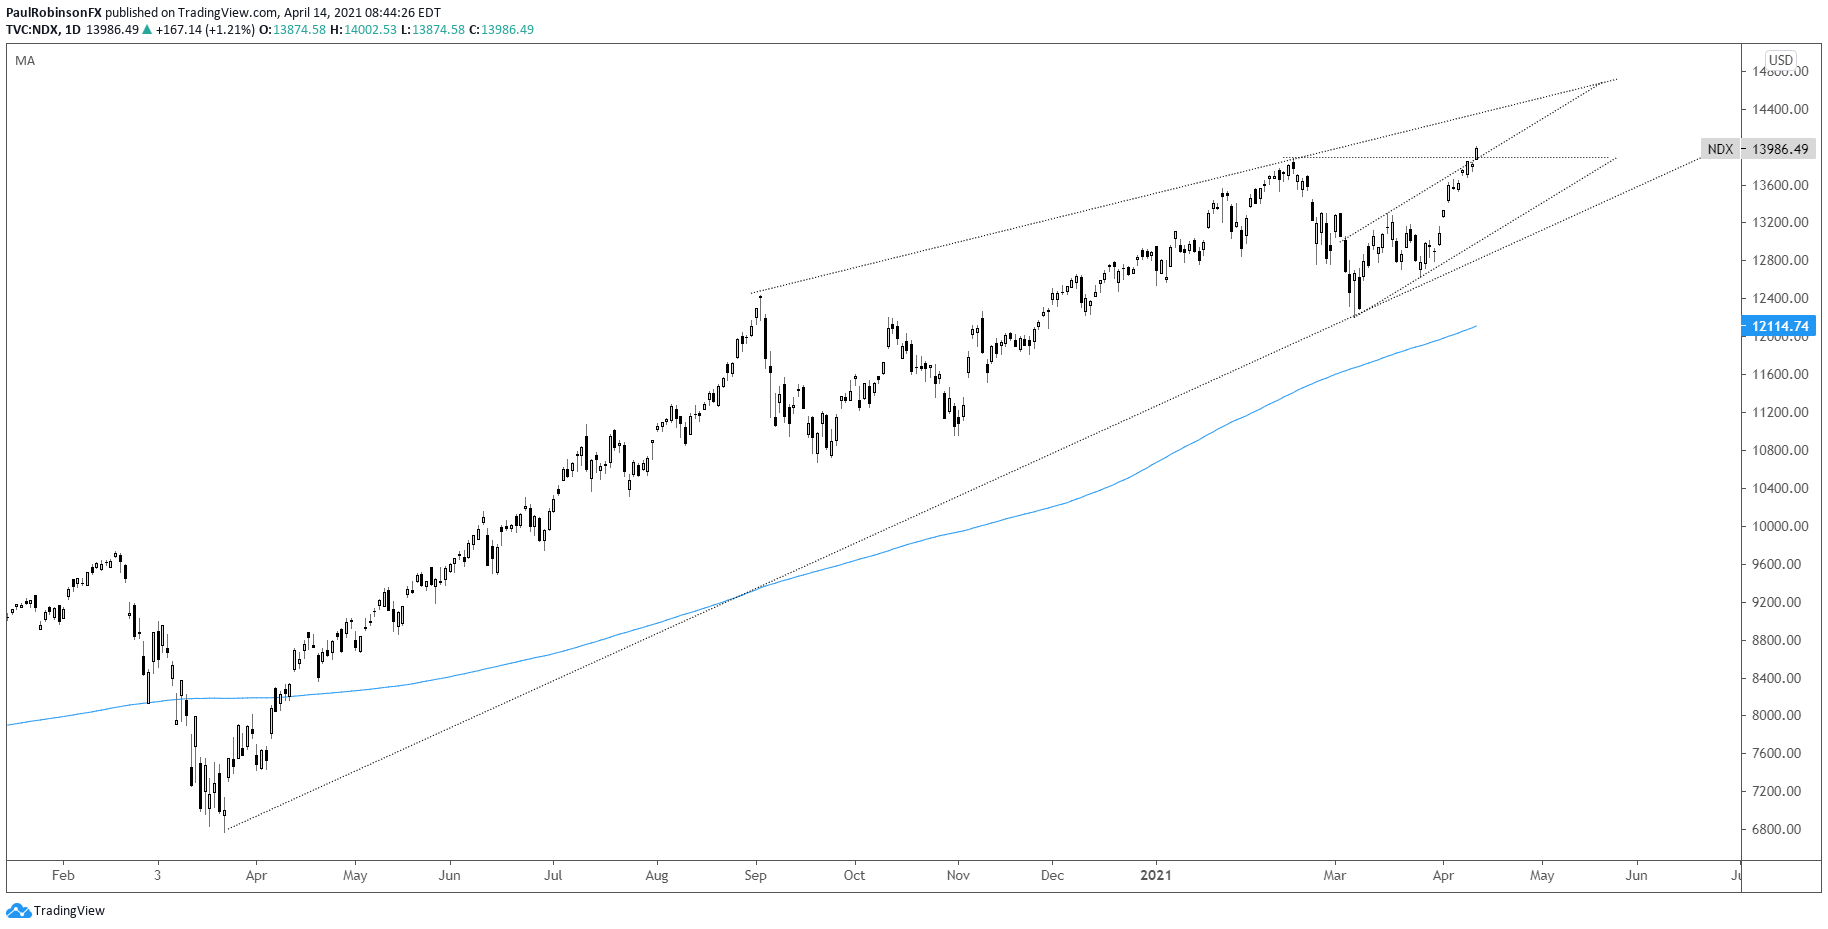
- Nasdaq 100 playing catch-up as flows rotate back into big techs
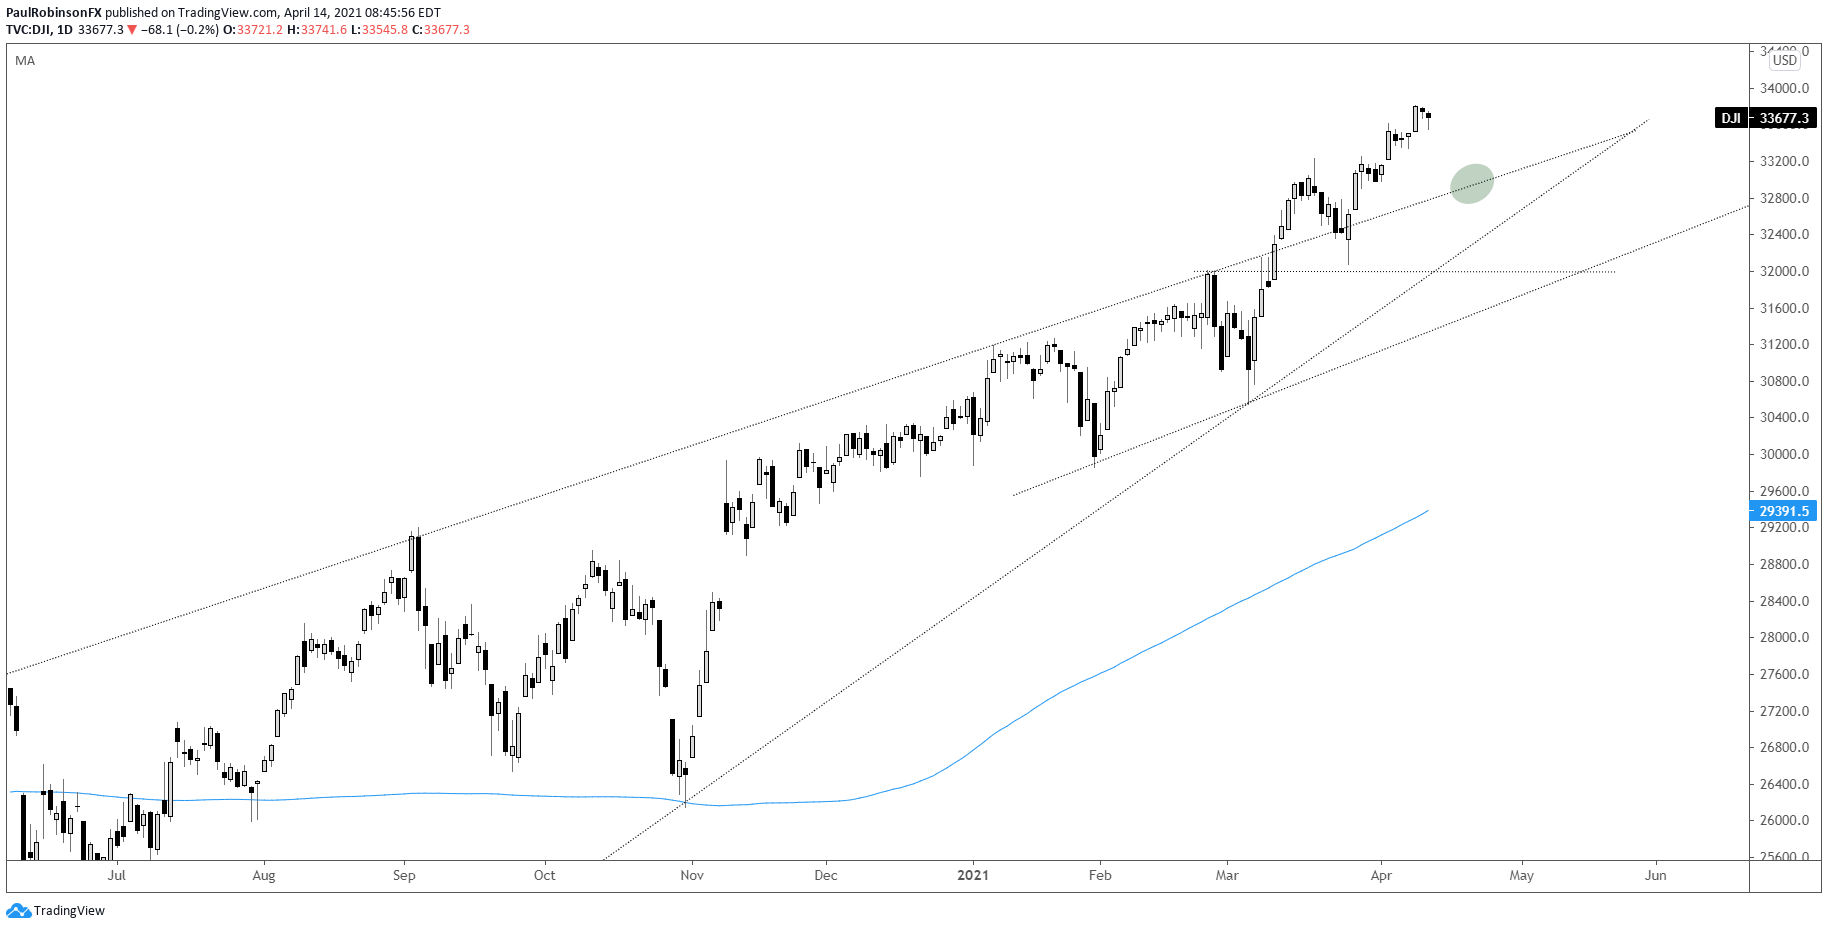
- Dow Jones gradually trending but not leading the way anymore
Dow Jones, S&P 500, Nasdaq 100 Technical Forecast
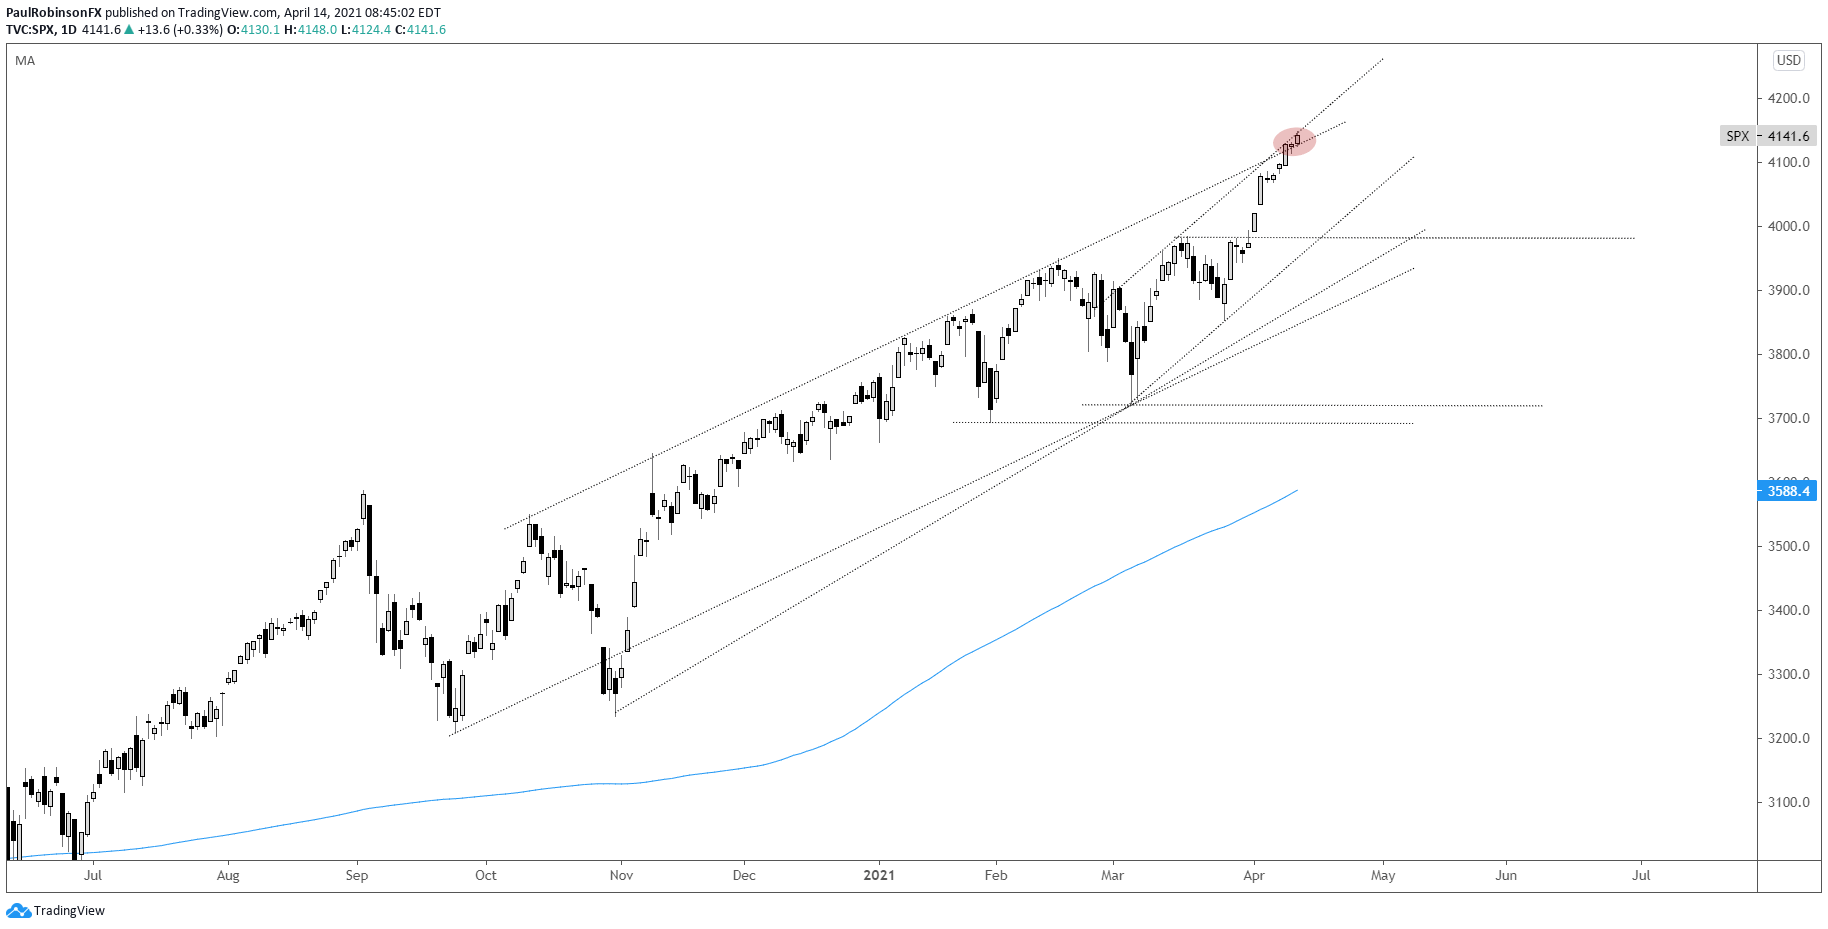
The S&P 500 is trading at resistance lines noted last week and could prove problematic as momentum is tepid. Fighting the tape, though, doesn’t hold a lot of appeal as these markets can be quite painful to short as the market bleeds higher.
But existing shorter-term minded longs may want to consider buttoning up trailing stops in the event of a set-back. As far as fresh longs are concerned, seeing a correction first could help set the table for an entry on a pullback or horizontal consolidation period.
On weakness it will be of interest as to how price action unfolds. A gradual decline similar to the one that took place in the latter half of last month would be viewed through a constructive lens as selling was mild. A sharp, sudden move, while may only prove to be short-lived, will still elevate the risk that a larger decline has begun.
It will take a bit of a dip to reach this point, but there is a trend-line running up from the March 4 low that could help act as support in the event the decline morphs into something more than a sideways consolidation pattern.

S&P 500 Daily Chart (pullback risk rising)
The Dow Jones is grinding higher as old-school stocks take a back seat to big tech. But still the trend is strong and not worthy from a risk/reward perspective to fight. On a pullback there is a slope under 33k to watch as potential support.
Dow Jones Daily Chart (watch slope support on weakness)
Dow Jones Chart by TradingView
The Nasdaq 100 has burst back onto the scene, notching itself a new record high as big tech is back in favor. FANMAG (FB, AMZN, NFLX, MSFT, AAPL, GOOG) is a group back to record highs. TSLA is perking back up too despite being well off the old highs.
Not a lot of great techs to watch here on the NDX chart, but outlook similar – caution appears warranted on both sides of the tape depending on how you are positioned.
Nasdaq 100 Daily Chart (lagging but trending towards new high)
Nasdaq 100 Chart by TradingView
Resources for Forex Traders
Whether you are a new or experienced trader, we have several resources available to help you; indicator for tracking trader sentiment, quarterly trading forecasts, analytical and educational webinars held daily, trading guides to help you improve trading performance, and one specifically for those who are new to forex.
---Written by Paul Robinson, Market Analyst
You can follow Paul on Twitter at @PaulRobinsonFX


