


Nikkei 225 Technical Analysis Talking Points:
- The Nikkei 225 remains under pressure
- It is currently just below key Fibonacci support
- If that conclusively breaks, the next level down will be key
Get trading hints and join our analysts for interactive live coverage of all major economic data at the DailyFX Webinars.
The Nikkei 225 has been struggling since it broke its previous range to the downside about a week ago, and it doesn’t look as though respite is coming anytime soon.
The sharp daily fall seen on August 10 was fundamentally rooted in new worries about Turkey’s economy, which added to existing fears about global trade. Technically it took the Tokyo blue-chip benchmark down through the first, 23.6% Fibonacci retracement of the rise up to the peaks of May from the lows of March.
That came in at 22,395 and, probably not coincidentally, had provided the base of a previous trading range which had endured since mid-July. Now the index is below the second, 38.2% retracement, which was at 21,993. We haven’t seen a daily close below this point yet, but on current showing it seems likely that we will.
Of course that would put market focus on the 50% retracement level which comes in at 21,669. Notably this was also the point at which the last bearish foray was beaten back on July 6. It seems quite likely that this support level will hold again if tested a second time, unless downside momentum picks up quite sharply.
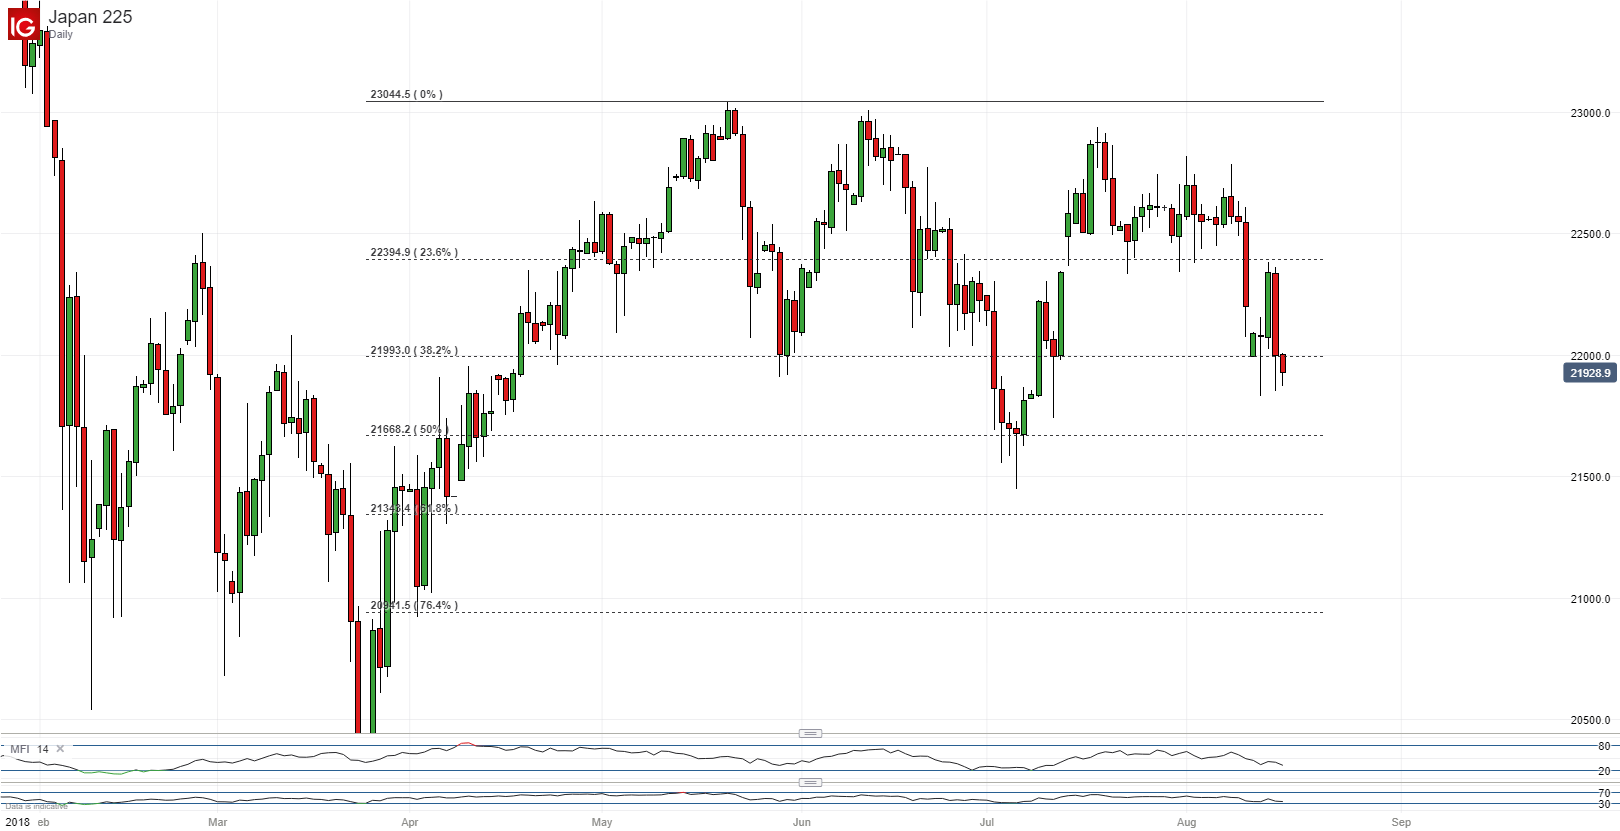
It is probably worth noting, however that the index has seen a rather bearish moving average crossover in the last couple of days, with the 100-day average moving below the 50-day. This is usually seen as a sign of impending trend change and the index has slipped pretty solidly ever since.
This is not an infallible guide of course but, all the same, it’s now more likely than not that that 50% retracement level will face a test in the next few days.
If the bulls can regain some momentum then their first target will probably be resistance at 22,344, which was the August 15 close. They will have their work cut out, however to fight back above that sharp drop of August 10.
Resources for Traders
Whether you’re new to trading or an old hand DailyFX has plenty of resources to help you. There’s our trading sentiment indicator which shows you live how IG clients are positioned right now. We also hold educational and analytical webinars and offer trading guides, with one specifically aimed at those new to foreign exchange markets. There’s also a Bitcoin guide. Be sure to make the most of them all. They were written by our seasoned trading experts and they’re all free.
--- Written by David Cottle, DailyFX Research
Follow David on Twitter @DavidCottleFX or use the Comments section below to get in touch!


