


To receive Ilya's analysis directly via email, please SIGN UP HERE
Talking Points:
- GBP/USD Technical Strategy: Flat
- Support: 1.5180, 1.4980, 1.4807
- Resistance: 1.5322, 1.5551, 1.5737
The British Pound stalled after correcting lower from the top of a falling channel encapsulating the down move against the US Dollar since mid-September. Near-term support is at 1.5180, the 14.6% Fibonacci retracement, with a break below that on a daily closing basis exposing the 23.6% Fib expansion at 1.4980. Alternatively, a move above the intersection of channel top resistance and the 23.6% retracement at 1.5322 opens the door for a challenge of the 38.2% threshold at 1.5551.
Prices are too close to support to justify entering short from a risk/reward perspective. On the other hand, the absence of a defined bullish reversal signal suggests that taking up the long side is premature. With that in mind, we will remain flat for now.
Add these technical levels directly to your charts with our Support/Resistance Wizard app!
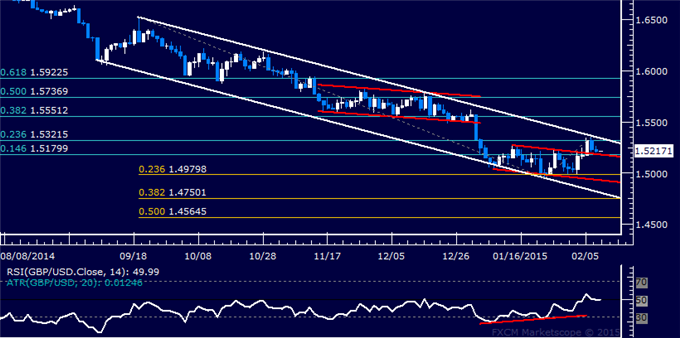
Daily Chart - Created Using FXCM Marketscope
--- Written by Ilya Spivak, Currency Strategist for DailyFX.com


