


Australian Dollar Technical Price Outlook: AUD/USD Weekly Trade Levels
- Australian Dollar technical trade level update - Weekly Chart
- AUD/USD rebounds off key technical pivot zone
- Aussie testing key inflection zone at 7016 – risk for further losses sub-7329
The Australian Dollar is up down more than 0.3% against the US Dollar this week with AUD/USD now testing a critical inflection zone for the fifth time this year- all five instances produced a move of no less than 3.3% off this threshold and we’re looking for a reaction here. These are the updated targets and invalidation levels that matter on the AUD/USD weekly price chart. for an in-depth breakdown of this Aussie trade setup and more.
Australian Dollar Price Chart – AUD/USD Weekly
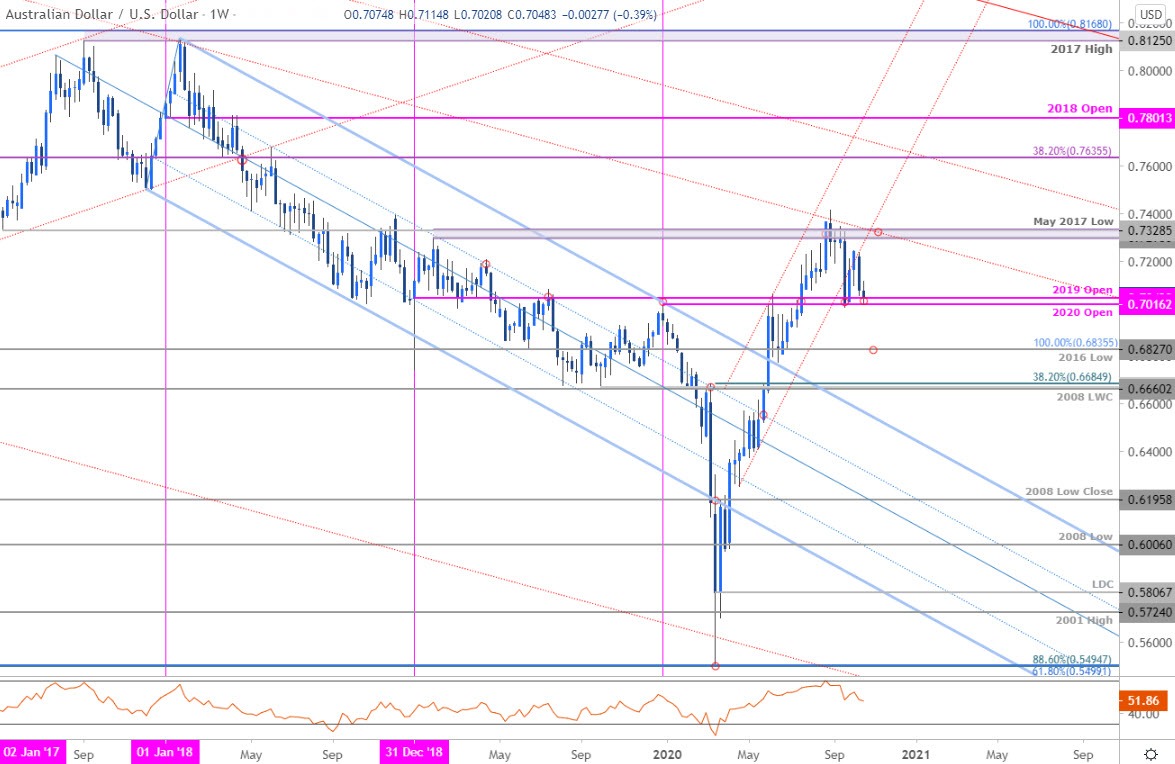
Chart Prepared by Michael Boutros, Technical Strategist; AUD/USD on Tradingview
Notes: In my last Australian Dollar Weekly Price Outlook we noted that Aussie had, “rebounded off a key inflection zone and the immediate focus is on possible topside exhaustion on this stretch early in the month… the risk remains tilted to the downside while below 7295 with a break / close below 7016 needed to suggest a deeper Aussie correction is underway.” AUD/USD registered a high at 7243 before reversing sharply lower with the decline testing key support again today at 7016/42- a region defined by the 2020/2019 objective yearly opens.
We’re looking for a reaction off this threshold with the immediate decline vulnerable while above. Monthly open resistance stands at 7160 with a breach / weekly close above the 2019 swing high / May 2017 low at 7295-7329 needed to mark resumption of the broader uptrend. A break / close below 7016 would keep the focus lower towards the 2016 low / 100% extension at 6827/35 backed by more significant weekly support at the 2008 low-week close / 2019 low / 38.2% Fibonacci retracement at 6660/85.

Bottom line: The Australian Dollar is once again testing a critical support zone and we’re looking for inflection this week. From a trading standpoint, a good zone to reduce short exposure / lower protective stops - recoveries should be limited to the monthly open IF price is indeed heading lower. Ultimately, a larger correction may offer more favorable entries before resumption of the late-March rally. Review my latest Australian Dollar Price Outlook for a closer look at the near-term AUD/USD technical trade levels.
For a complete breakdown of Michael’s trading strategy, review his Foundations of Technical Analysis series on Building a Trading Strategy
Australian Dollar Trader Sentiment – AUD/USD Price Chart
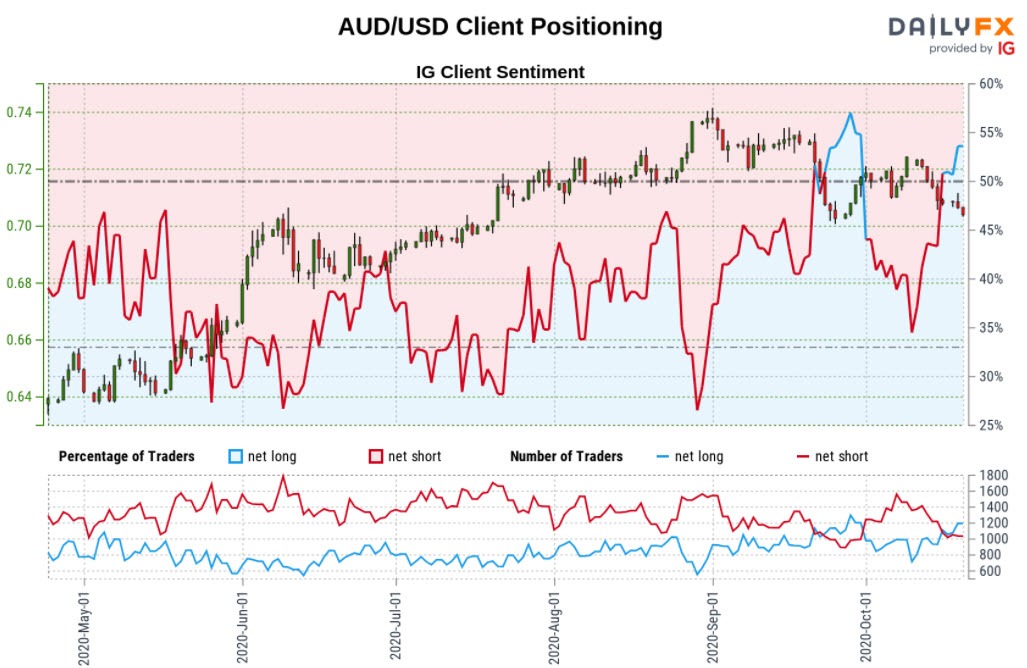
- A summary of IG Client Sentiment shows traders are net-long AUD/USD - the ratio stands at +1.18 (54.05% of traders are long) – neutral reading
- Long positions are 5.97% higher than yesterday and 31.77% higher from last week
- Short positions are1.20% lower than yesterday and 22.60% lower from last week
- We typically take a contrarian view to crowd sentiment, and the fact traders are net-long suggests AUD/USD prices may continue to fall. Traders are further net-long than yesterday and last week, and the combination of current positioning and recent changes gives us a stronger AUD/USD-bearish contrarian trading bias from a sentiment standpoint.
| Change in | Longs | Shorts | OI |
| Daily | -15% | 49% | 5% |
| Weekly | -17% | 23% | -3% |
---
Key Australia / US Data Releases
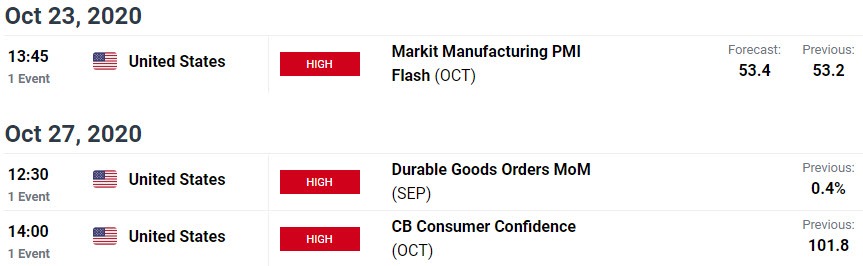
Economic Calendar - latest economic developments and upcoming event risk.
Previous Weekly Technical Charts
- British Pound (GBP/USD)
- Gold (XAU/USD)
- Euro (EUR/USD)
- Australian Dollar (AUD/USD)
- Canadian Dollar (USD/CAD)
--- Written by Michael Boutros, Technical Currency Strategist with DailyFX
Follow Michael on Twitter @MBForex


