


Aussie Dollar vs US Dollar Technical Forecast
AUD/USD – Weaker Bulls
On April 30, AUD/USD took off to an over seven-week high at 0.6569. However, the price retreated after, as some bulls seemed to cut back. Last week, the price rallied yet could not break above the aforementioned high, highlighting a weaker uptrend.
This week, the Relative Strength Index (RSI) has fallen from 60 to 52, indicating that bulls were losing momentum.
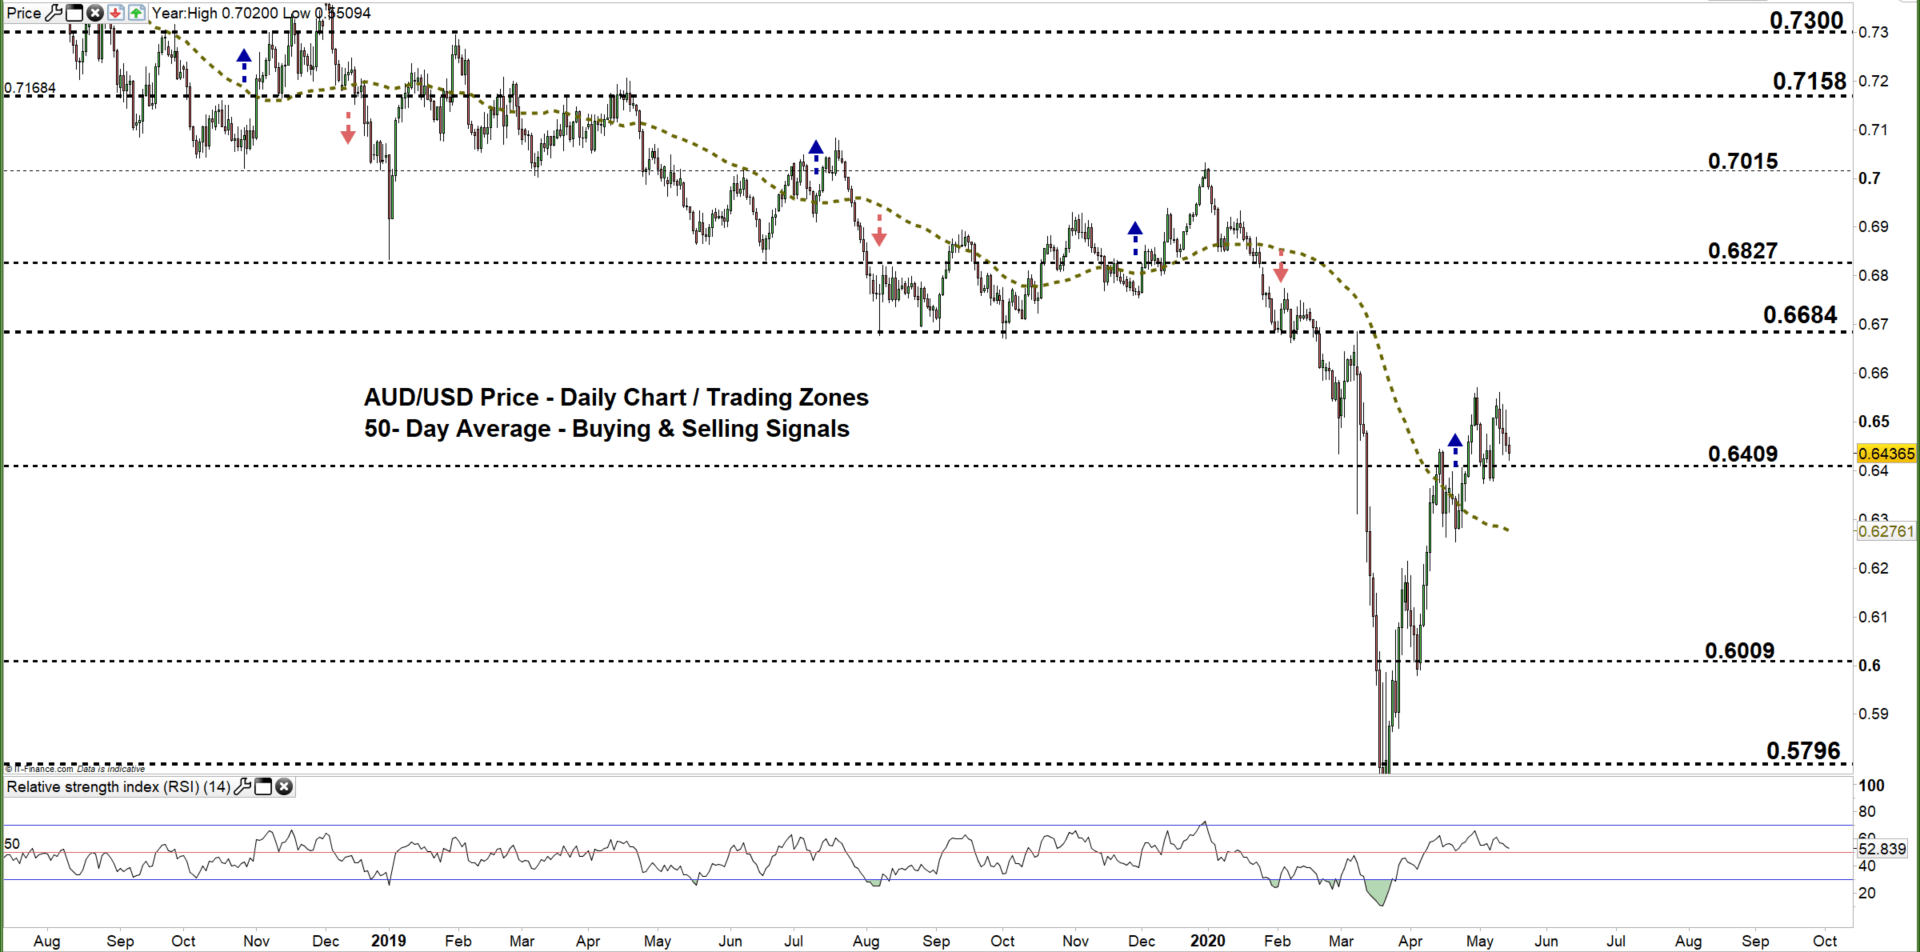
AUD/USD DAILY PRICE CHART (June 29, 2018 – May 14, 2020) Zoomed Out

AUD/USD DAILY PRICE CHART (FEB 20 – May 14, 2020) Zoomed IN
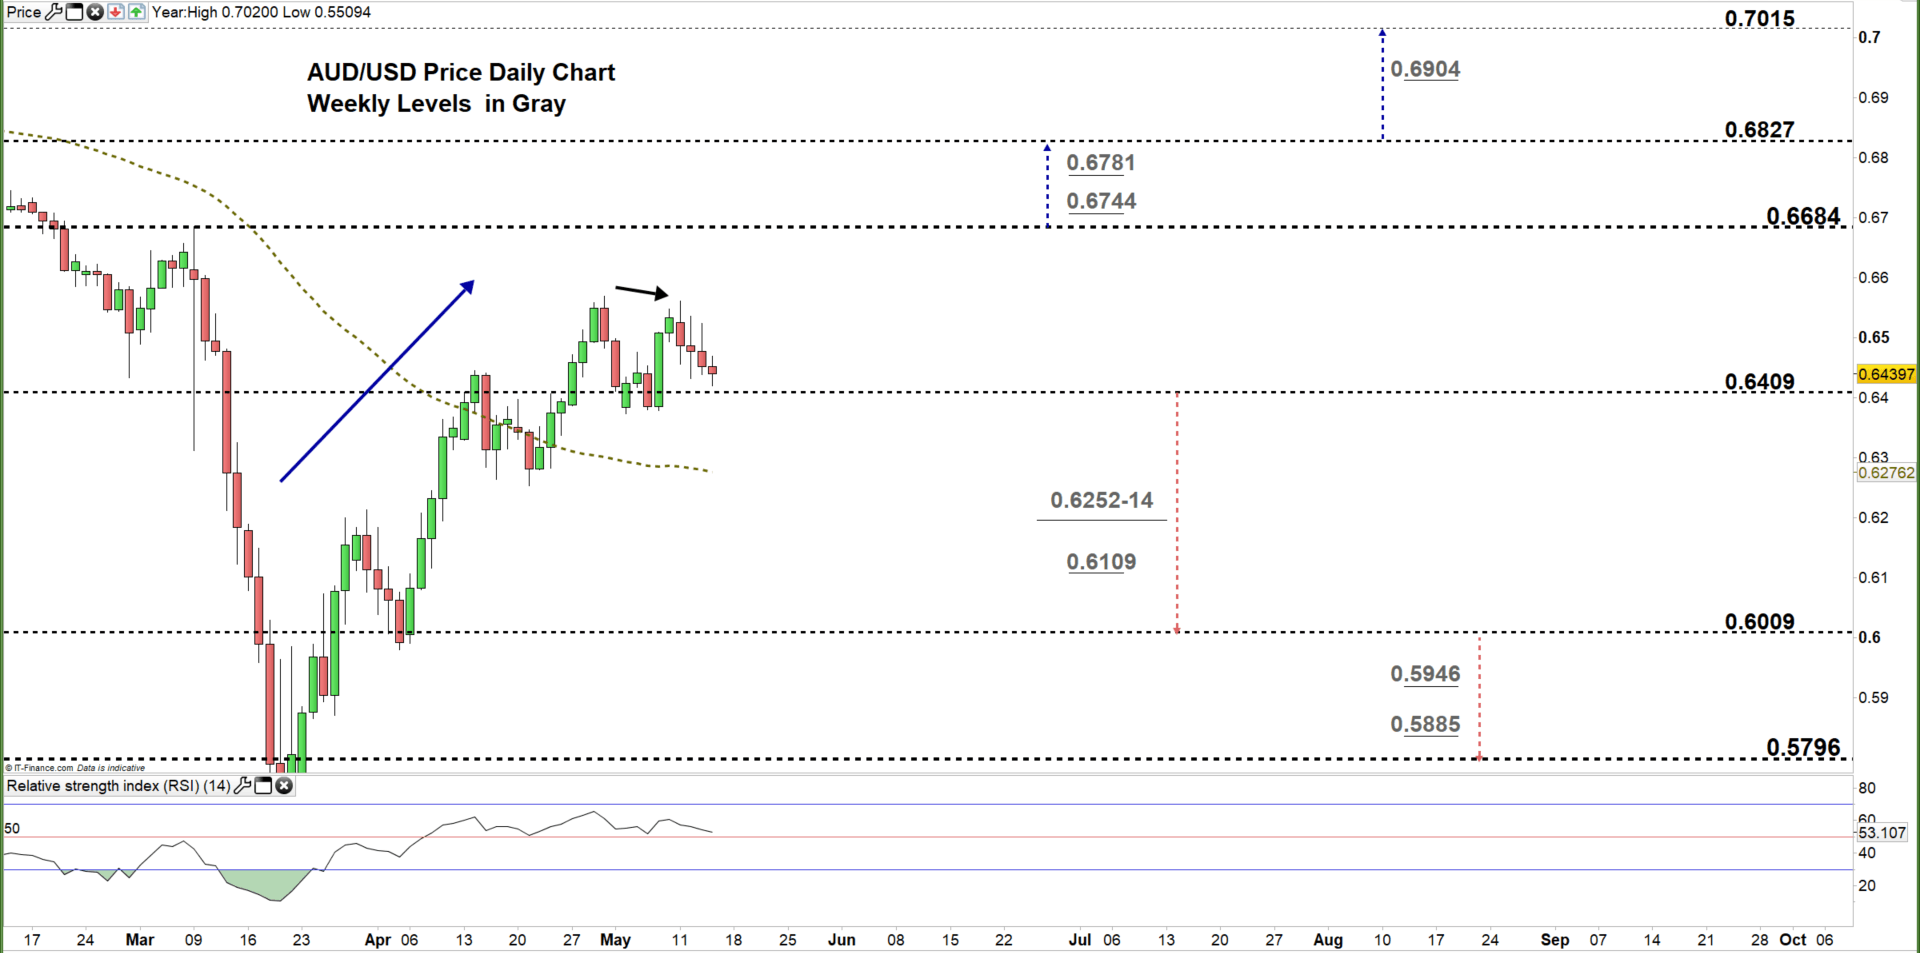
Looking at the daily chart, on April 8 AUD/USD rallied above the March 31 high at 0.6214 then started bullish momentum creating higher highs with higher lows. On Monday, the market corrected its uptrend and created a lower high at 0.6561. Later on, the price pressed eyeing a test of the low end of the current trading zone 0.6409 - 0.6684.
A close below the low end of the aforementioned zone could send AUDUSD towards 0.6009. A further close below that level may encourage bears to press towards 0.5796. Nevertheless, the weekly support levels and area marked on the chart (zoomed in) should be kept in focus.
On the flip side, any failure in closing below the low end of the zone reflects that some bulls are still holding on. This could lead the pair to develop a symmetrical triangle and possibly continue its uptrend move towards the high end of the zone. A further close above that level may send the price even higher towards 0.6827. That said, the weekly resistance levels underscored on the chart should be monitored.

AUD/USD Four-Hour PRICE CHART (April 6 – May 14, 2020)
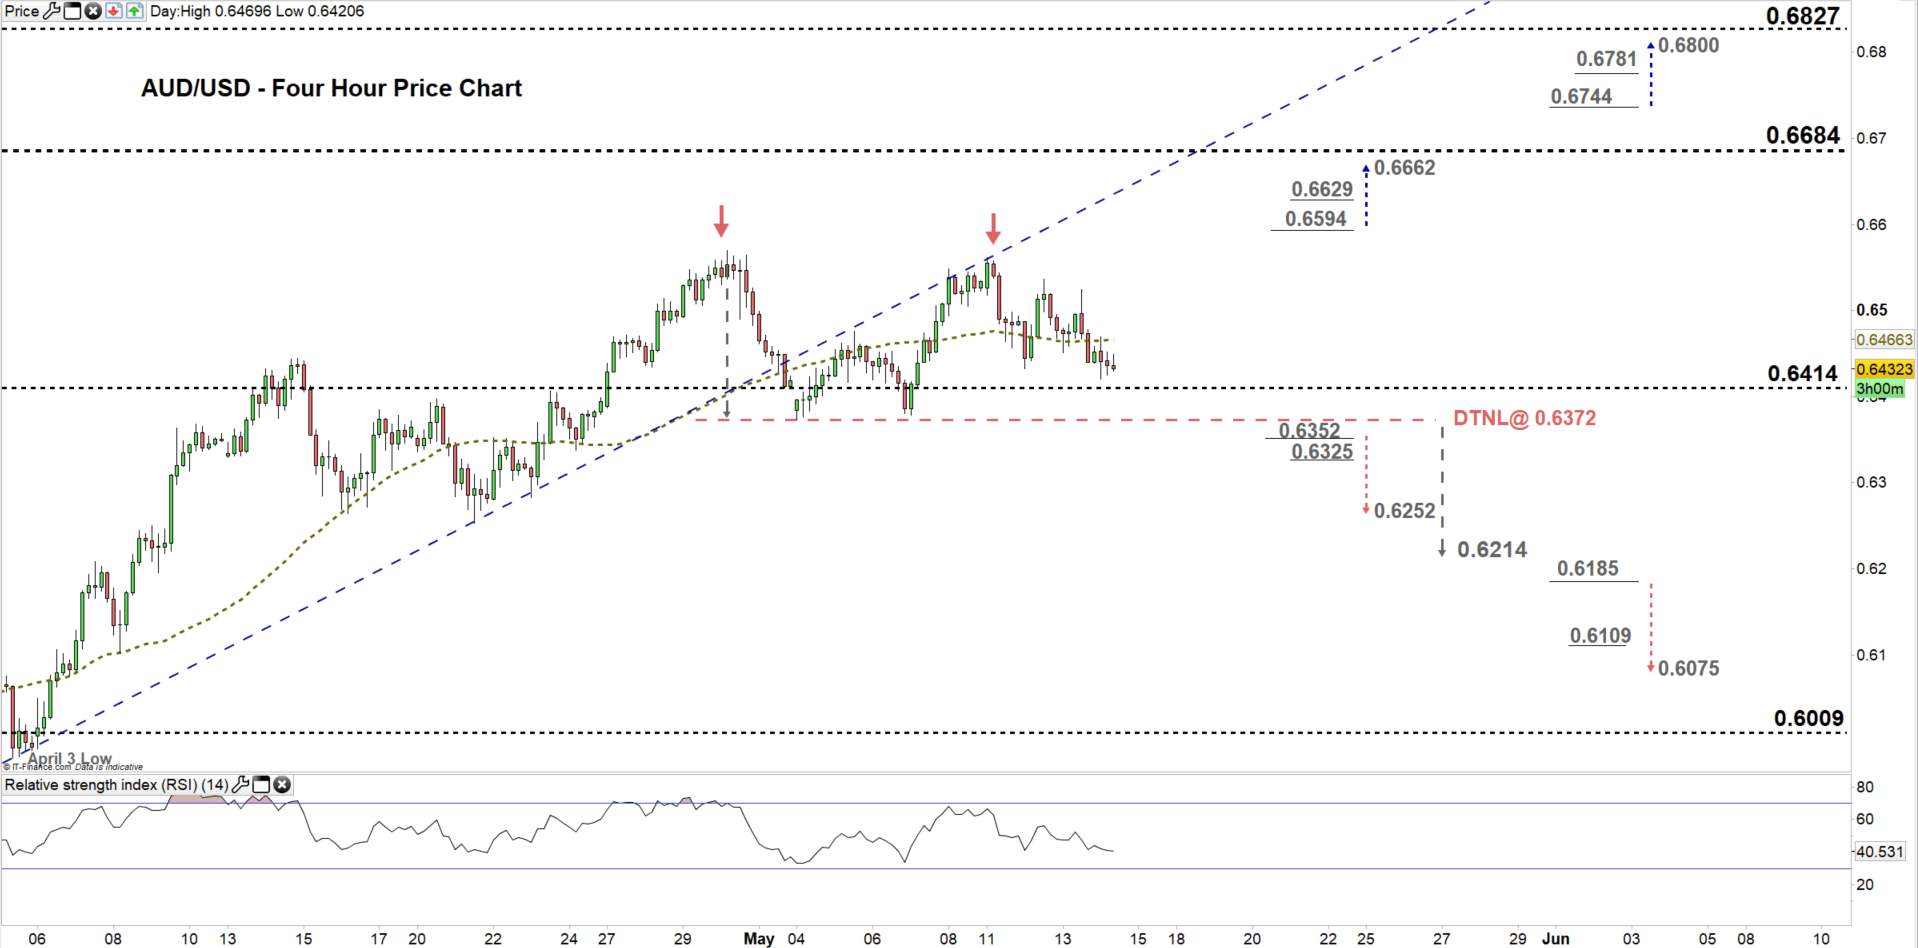
Based on analysis of the four-hour chart, on May 1 AUD/USD violated the uptrend move originated from the April 3 low at 0.5980 then remained trading below this line. Additionally, the pair double topped signaling a possible reversal. Any violation of the neckline of this pattern located at 0.6372 would be considered a bearish signal.
A break below 0.6352 would be considered another bearish signal and may send AUDUSD towards 0.6252. In that scenario, the support level underlined on the chart should be watched closely. In turn, any break in the other direction i.e. above 0.6594 may trigger a rally towards 0.6662. Although, the weekly resistance level printed on the chart should be considered.
See the chart to find out more about the key technical levels in a further bullish/bearish scenario.
Written By: Mahmoud Alkudsi, Market Analyst
Please feel free to contact me on Twitter: @Malkudsi


